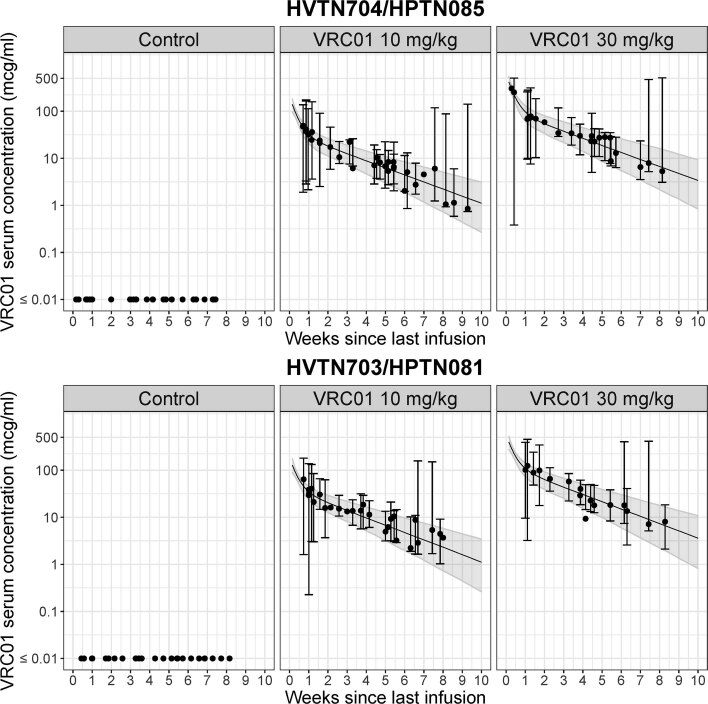
Extended Data Fig. 2. Estimated serum VRC01 concentration (filled black dot) at the estimated time of infection (median of the Bayesian posterior distribution of infection time) since last infusion in all primary endpoint HIV-1 cases, by randomization arm in each trial.
(a) HVTN 704/HPTN 085 (n = 36 cases in Control, n = 31 cases in the 10 mg/kg arm and n = 25 cases in the 30 mg/kg arm) with an additional 3 cases not shown in the 30 mg/kg panel due to estimated infection time > 10 weeks since last infusion, and 7 and 1 case(s) not shown in the Control and 10 mg/kg panels, respectively, due to estimated infection time ≤ 0 or not being available. (b) HVTN 703/HPTN 081 (n = 27 cases in Control, n = 28 cases in the 10 mg/kg arm and n = 17 cases in the 30 mg/kg arm) with an additional 2 and 2 cases not shown in the Control and 30 mg/kg panels, respectively, due to estimated infection time ≤ 0 or not being available. For each VRC01-recipient case, vertical error bars represent the 90% prediction interval around the estimated serum VRC01 concentration at the estimated infection time (center of the error bars), accounting for variabilities in both the estimation of the infection time and the estimation of concentration are displayed for each VRC01-recipient case. The former uncertainty is incorporated via resampling infection time from the Bayesian posterior distribution of infection time and the latter is incorporated via variabilities estimated based on the final popPK model for the daily grid concentrations at each given estimated infection time (see Methods). The solid black line represents the median and the shaded area represents bands covered by the 2.5th and 97.5th percentiles of the estimated concentrations over time within each dose group using the median body weight of participants in the case-control cohort, accounting for between-individual variabilities estimated based on the final popPK model.

