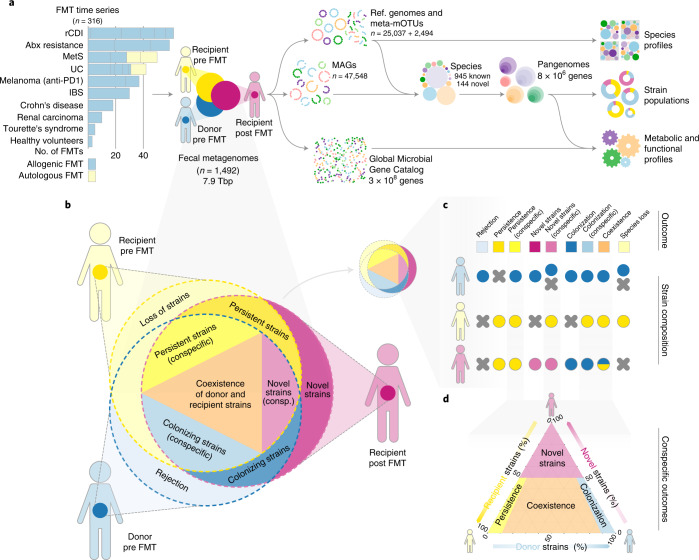
Fig. 1. Study design and workflow overview.
a, We analyzed a dataset of 316 FMT time series across ten disease indications and 22 cohorts, totaling 1,492 fecal metagenomes. Species pangenomes were built from reference genomes and newly generated MAGs and profiled across samples for taxonomic, functional and strain population composition, based on microbial SNVs and differential gene content. b, Each allogenic FMT was represented as a triad of donor pre-FMT (blue hues), recipient pre-FMT (yellow) and post-FMT (purple) samples; each sample’s strain population is indicated as an overlapping circle. c, FMT strain-level outcomes for each species were scored using patterns of determinant SNVs and gene content (Supplementary Table 5). d, Ternary diagram of the strain population space for conspecific recipient strain persistence, donor strain colonization, donor–recipient coexistence and influx of novel strains.

