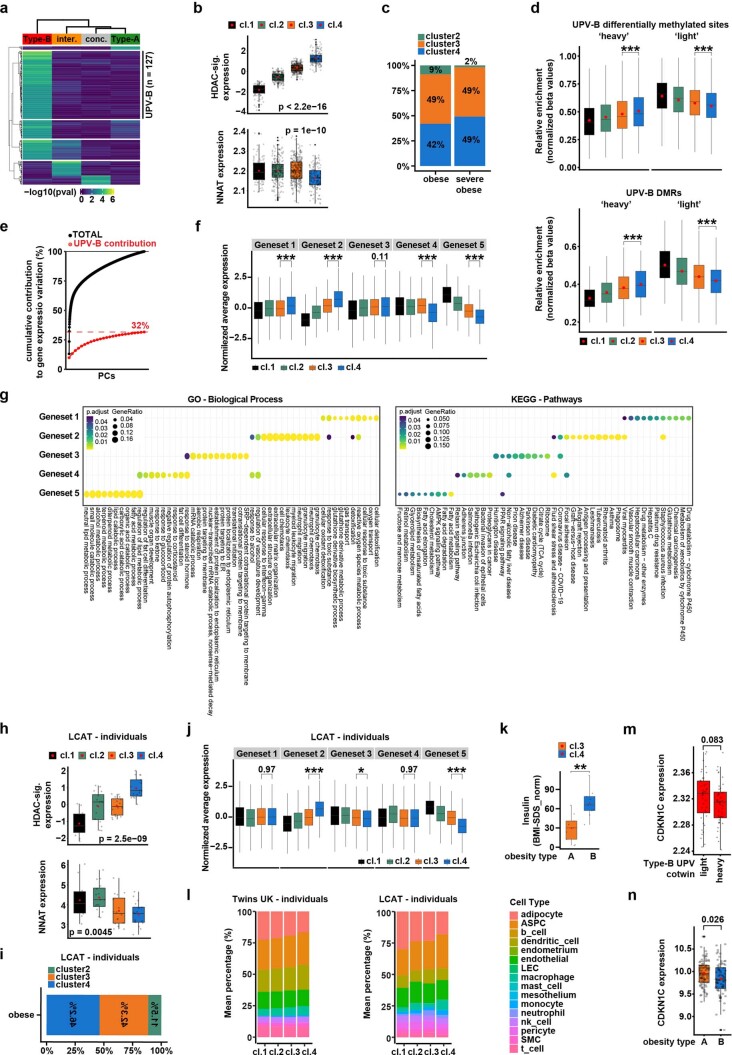
Extended Data Fig. 9. Characterization of adults’ and childrens’ clusters.
a, Heat map of hierarchical clustering of DEGs between cotwins belonging to indicated groups. b, Boxplot showing the mean expression of HDAC-signature (above) or NNAT (below), among indicated clusters. p-values (2.2e-16; 1e-10) from ANOVA. c, Barplot showing obesity distribution among clusters. d, Boxplot showing normalized beta values for differentially methylated sites (above, p = 2.2e-16 and 2.2e-16) or regions (below, p = 0.0005 and 2.6e-8), among cotwins. ‘Heavy’- and ‘light’ enriched DNA methylated sites are reported. *** (p ≤ 0.001) from two-tails t-tests. e, UPV-B genes estimate of contribution to overall transcriptional variability in the TwinsUK cohort. Cumulative contribution of all principal components (black dots/line) and contribution of the most UPV-B-associated PCs (red dots/line) are reported. f, Boxplot showing mean expression of genes belonging to five genesets form Fig. 5b, among clusters. *** (p = 2.2e-16) from one-sided Tukey’s multiple comparisons test, following significant ANOVA. g, Complete gene ontology and pathway enrichment analysis for the 5 genesets from the heat map of TwinsUK individuals. h, Boxplot showing mean expression of HDAC-signature (above) or NNAT (below), among the clusters of the LCAT cohort. p-values from ANOVA. i, Barplot showing obesity distribution, among cluster in the LCAT cohort. j, Boxplot showing mean expression of genes belonging to the five genesets form Fig. 5b, among clusters in the LCAT cohort. * (p = 0.004), *** (p = 2.2e-16) from one-sided Tukey’s multiple comparisons test, following significant ANOVA. k, Box-plots showing distributions of serum insulin levels normalized on BMI-SDS, among children with obesity belonging to indicated clusters. ** (p = 0.0016) from two-tails t-tests. l, Barplots showing average cell-type compositions among transcriptional profiles of individuals belonging to indicated clusters. ASPC = adipose stem and progenitor cells, LEC = lymphatic endothelial cells, SMC = smooth muscle cells. m-n, Box-plots showing CDKN1C expression between ‘light’ and ‘heavy’ Type-B UPV cotwins (m) and Type-A/-B obesities (n). In all box-plots, lower and upper hinges = 25th and 75th percentiles. The upper/lower whiskers = largest/smallest observation less/greater than upper/lower hinge + 1.5 * IQR. Central median = 50% quantile. p-values from one-tail (m) or two-tails (n) t-tests.

