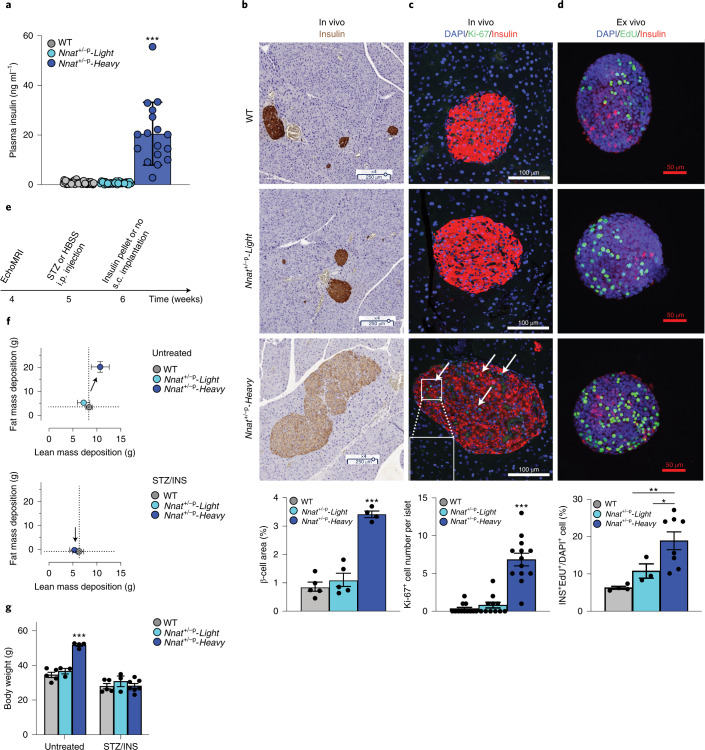
Fig. 2. Nnat+/-p-overgrowth exhibits autonomous β-cell hyperplasia and hyperinsulinemia.
a, Plasma insulin was measured from 16-week-old male animals fasted for 6 h. Each group had at least 17 animals. ***Adjusted P ≤ 0.001, as assessed by one-sided Tukey’s multiple comparisons test. b, Insulin-positive β-cells (brown) in Nnat+/-p pancreata were detected by immunohistochemistry staining. Scale bar, 250 µm. β-cell area was quantified as percentage of the entire pancreas area. Each group had at least four animals. ***Adjusted P ≤ 0.001, as assessed by one-sided Tukey’s multiple comparisons test. c, In vivo immunofluorescence was performed for proliferating β-cells (white arrows) in primary islets from 16-week-old animals (red, insulin; blue, DAPI; green, Ki-67). Scale bar, 100 µm. Ki-67+ β-cells were quantified and each group had at least 11 islets. ***Adjusted P ≤ 0.001, as assessed by one-sided Tukey’s multiple comparisons test. DAPI, 4,6-diamidino-2-phenylindole. d, Ex vivo immunofluorescence was performed for proliferating β-cells by EdU-incorporation. Size-matched primary islets from 5–6-week-old mice were cultured for 3 days before the EdU-incorporation assay (red, insulin; blue, DAPI; green, EdU). Scale bar, 50 µm. EdU+ proliferating β-cells were quantified and each group had at least three islets. *Two-tailed P ≤ 0.05, **two-tailed P ≤ 0.01, by Welch’s t-test. e, STZ (300 mg kg−1) was administered at 5 weeks of age when the Nnat+/-p-Heavy morphs first show signs of accelerated weight gain. An equal number of subcutaneous (s.c.) insulin implants were administered after 5 days and 1 month after the STZ injection to all STZ groups such that relative euglycemia was maintained. i.p., intraperitoneal. f, Lean and fat mass gained between 4 and 12 weeks of age for untreated and STZ-treated Nnat+/-p littermates. Each group has at least three animals. INS, insulin. g, Body weight at termination highlights how Nnat+/-p-Heavy mice fail to exhibit the overgrowth phenotype on combined STZ/insulin treatment. ***Adjusted P = 0.0001, as assessed by one-sided Tukey’s multiple comparisons test. All data are presented as mean ± s.e.m.

