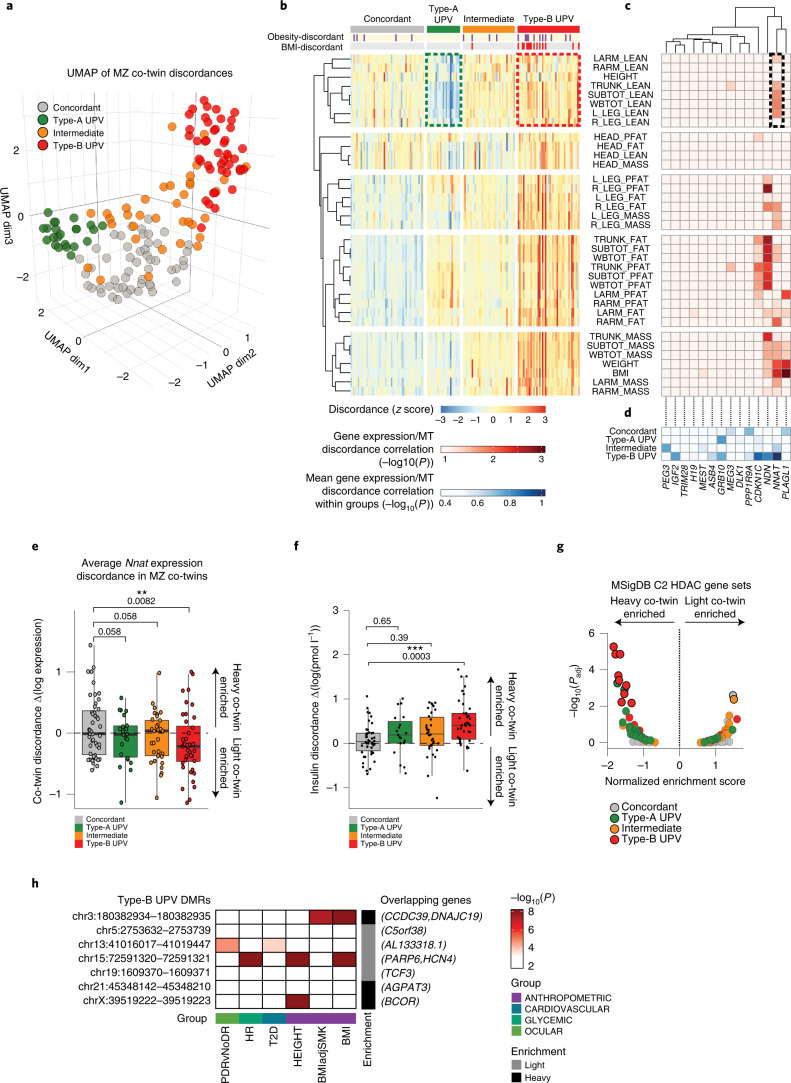
Fig. 4. Characterization of human UPV.
a, UMAP projection of MZ co-twin couples, according to 35 morphometric discordances. b, Heat map of hierarchical clustering of morphometric discordances among MZ co-twin couples. Obesity-discordant co-twins indicate that only one co-twin is affected by obesity (BMI > 30). BMI discordant co-twins, BMI difference >5 BMI points. Dashed colored boxes highlight distinct lean mass discordances between Type-A and Type-B UPV. c, Heat map showing the hierarchical clustering of Trim28/IGN1 genes based on the correlation of their expression discordance and indicated phenotypic discordances. A dashed black box highlights NNAT expression discordance correlation with phenotypic discordances of those traits that distinguish Type-A and Type-B UPV. d, Heat map showing the hierarchical clustering of Trim28/IGN1 genes based on the average correlation of their expression discordance and all phenotypic discordances, stratified by four co-twin pairs’ clusters. e, Box-plots representing discordance of NNAT expression, among MZ co-twins, belonging to the indicated clusters. **P = 0.0082, as assessed by one-tailed t-tests. f, Box-plots representing serum insulin discordance, among MZ co-twins, belonging to the indicated groups. ***P = 0.0003 as assessed by one-sided Tukey’s multiple comparisons test, following one-way analysis of variance (ANOVA). In all box-plots, lower and upper hinges indicate 25th and 75th percentiles. The upper/lower whiskers indicate largest/smallest observation less/greater than upper/lower hinge + 1.5 ×IQR. Central median indicates 50% quantile. g, GSEA results of HDAC-responsive gene sets between the ‘light’ and ‘heavy’ co-twins, belonging to the indicated MZ co-twins groups. Solid and transparent colored dots, highlight either statistically significant or not significant enrichments, respectively (adjusted P value cutoff <0.01). h, Heat map showing association of single-nucleotide polymorphisms (SNPs) and indicated phenotypic traits, within the DMRs identified between ‘light’ and ‘heavy’ Type-B UPV co-twins. White boxes indicate no significant associations (P > 1 × 10⁻³), dark-red boxes indicate genome-wide significant associations (P < 1 × 10⁻⁸). Nearest are reported. Gray and black boxes indicate the enrichment of DMR in either the ‘light’ or ‘heavy’ co-twin. BMIadjSMK, BMI adjusted by smoking; T2D, type 2 diabetes; HR, heart rate; PDR, proliferative diabetic retinopathy; PDRvNoDR, PDR versus no PDR.

