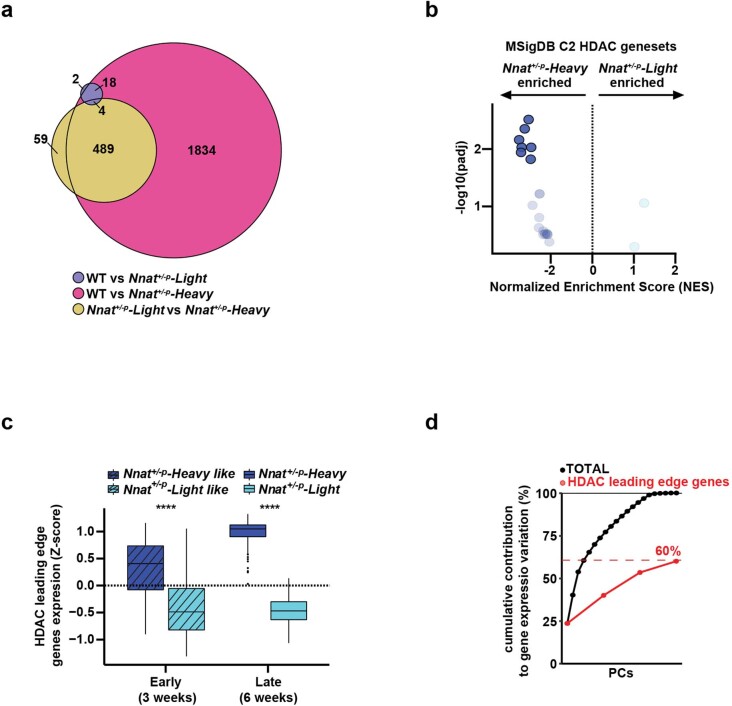
Extended Data Fig. 4. Dysregulated HDAC-related transcriptome precedes the Nnat+/-p-overgrowth.
a, Venn diagram of differential gene expression analyses of islets transcriptome of 6 weeks old mice comparing between Nnat+/-p-Heavy, Nnat+/-p-Light morphs and WT littermates. b, GSEA results of HDAC-responsive gene sets between the Nnat+/-p-Light and Nnat+/-p-Heavy morphs, showing a specific enrichment in the latter. Solid and transparent colored dots, highlight either statistically significant or not significant enrichments, respectively (adjusted p-value cutoff < 0.05). c, Gene expression (Z-score) comparison was performed for HDAC gene set leading-edge genes between Nnat+/-p-Heavy-like and Nnat+/-p-Light-like morphs (early stage) and Nnat+/-p-Heavy and Nnat+/-p-Light morphs (late stage). **** (p ≤ 0.001) as assessed by two-tails t-tests. In all box-plots, the lower and upper hinges = 25th and 75th percentiles. The upper/lower whiskers = largest/smallest observation less/greater than upper/lower hinge + 1.5 * IQR. Central median = 50% quantile. d, Estimate of the contribution of the HDAC-responsive genes, to the overall transcriptional variability between WT, Nnat+/-p-Heavy and Nnat+/-p-Light mice. Following PCA, the dotplot shows either the cumulative contribution of all principal components (PCs) to gene expression variation (black dots/line), or the contribution of the top four PCs (red dots/line), mostly associated with the HDAC-leading-edge genes from (b). The cumulative contribution of these four PCs is describing 58.7% of total gene expression variation.

