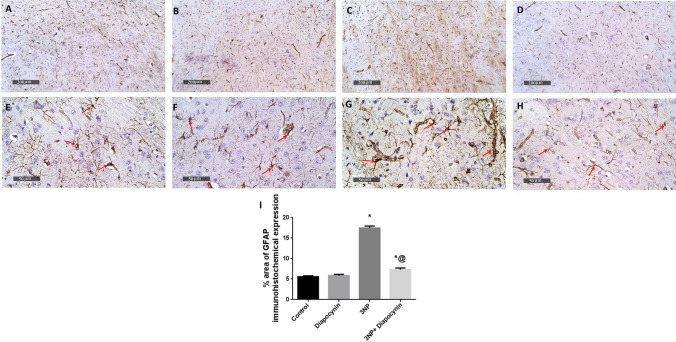
Fig. 10.
Effect of diapocynin administration on 3-NP-induced immunohistochemical expression of GFAP. Photomicrographs of control group (A, E), diapocynin group (B, F), 3-NP group (C, G), and 3-NP + diapocynin group (D, H). Black arrows indicate GFAP immunoexpression. Magnifications: ×100 (A–D) and ×400 (E–H). I A bar chart representing the mean percentage of GFAP immunoexpression in each group with each bar with vertical line illustrating the mean ± S.E.M. of 3 rats per group. Data were analyzed using one-way ANOVA followed by Tukey’s post hoc test. *p < 0.05 vs. control, @p < 0.05 vs. 3NP group. 3-NP 3-nitropropionic acid, GFAP glial fibrillary acidic protein

