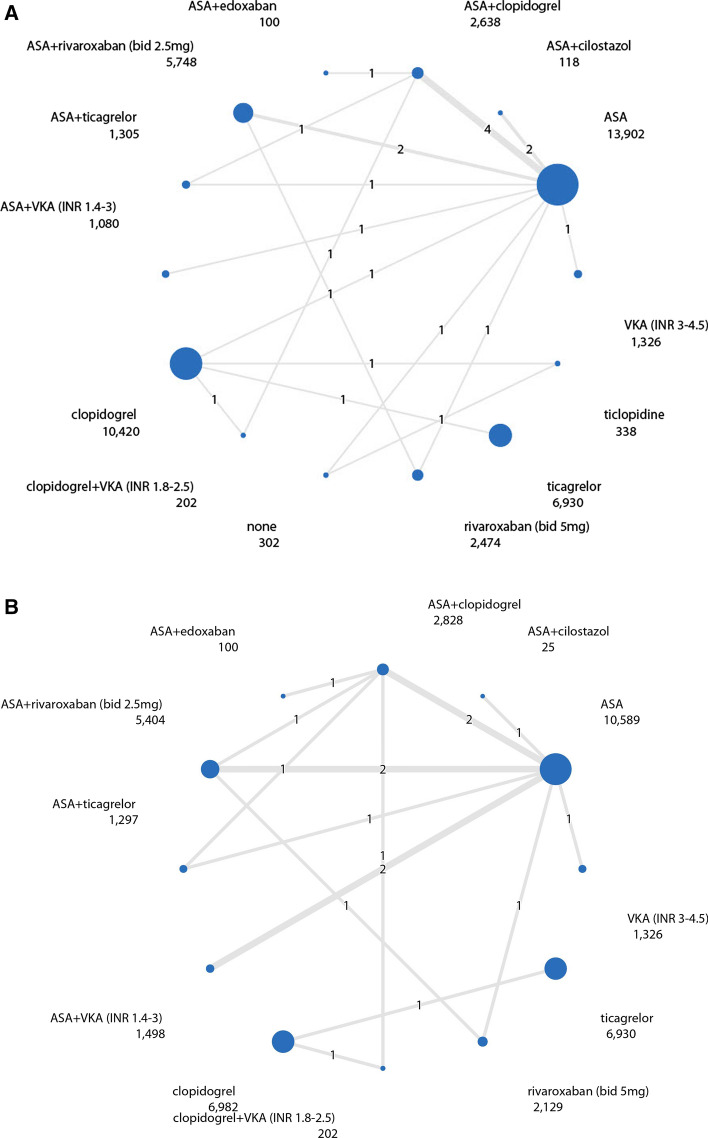
Fig. 2.
Network diagram of antithrombotic regimens. The line width is proportional to the sample size of each direct comparison. The number in the middle of the line represents the number of direct comparisons. The number below the antithrombotic regimen corresponds with the total number of participants on that specific antithrombotic therapy. A Network diagram of MACE. B Network diagram of major bleedings. ASA acetylsalicylic acid, bid bi-daily, INR international normalized ratio, MACE major adverse cardiovascular events, VKA vitamin K antagonist. *Patients who used no antithrombotic treatment, did receive placebo tablets

