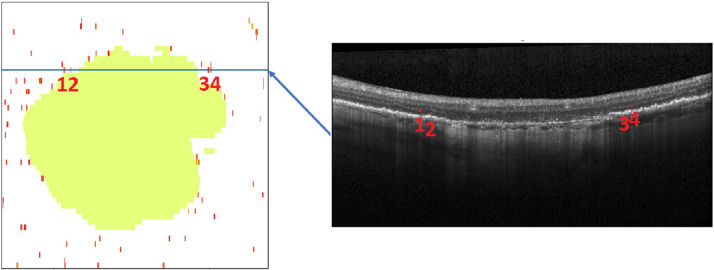
Fig. 1. Illustration of the registration procedure.
The left image shows the projection of geographic atrophy (green), extracted from fundus autofluorescence, on the optical coherence tomography C-scan viewed from above. The right image shows the marked B-scan (blue line). The numbers 1–4 indicate the same hyperreflective foci in both images.

