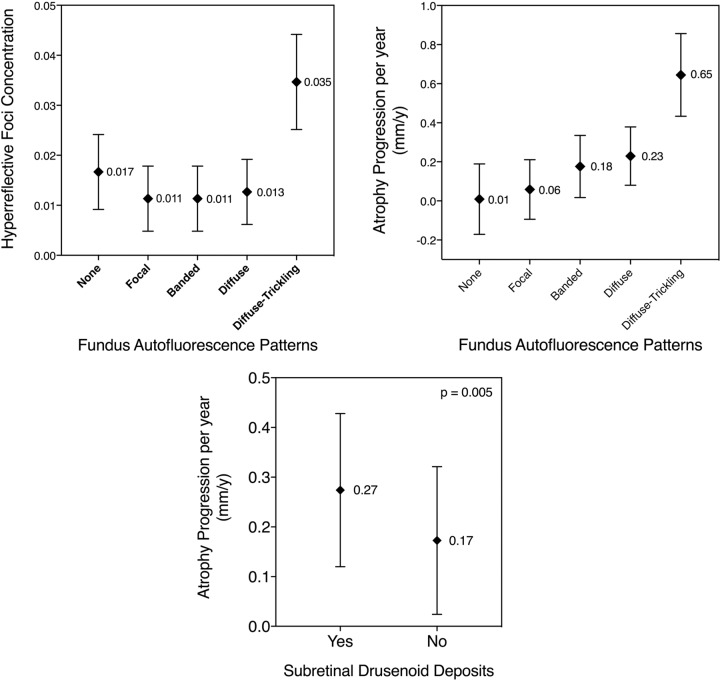
Fig. 2. Pairwise comparison of mean and 95% confidence intervals.
Top left: comparison of hyperreflective foci (HRF) concentrations between fundus autofluorescence (FAF) patterns. Statistically significant differences in HRF concentrations were found for diffuse-trickling vs. any other pattern (all p < 0.001), none vs. focal (p = 0.03), and none vs. banded (p = 0.03). All other pairwise comparisons were not significant (p > 0.05). Adjustment for multiplicity through Bonferroni correction was performed. Top right: comparison of geographic atrophy (GA) progression (mm/y) between FAF patterns. Statistically significant differences in growth rates were found for diffuse-trickling vs. any other pattern (all p < 0.001), none vs. diffuse (p = 0.002), and focal vs. diffuse (p = 0.002). All other pairwise comparisons were not significant (p > 0.05). Adjustment for multiplicity through Bonferroni correction was performed. Bottom: comparison of GA progression (mm/y) in eyes with and without subretinal drusenoid deposits. The difference between the two groups was statistically significant (p = 0.005).

