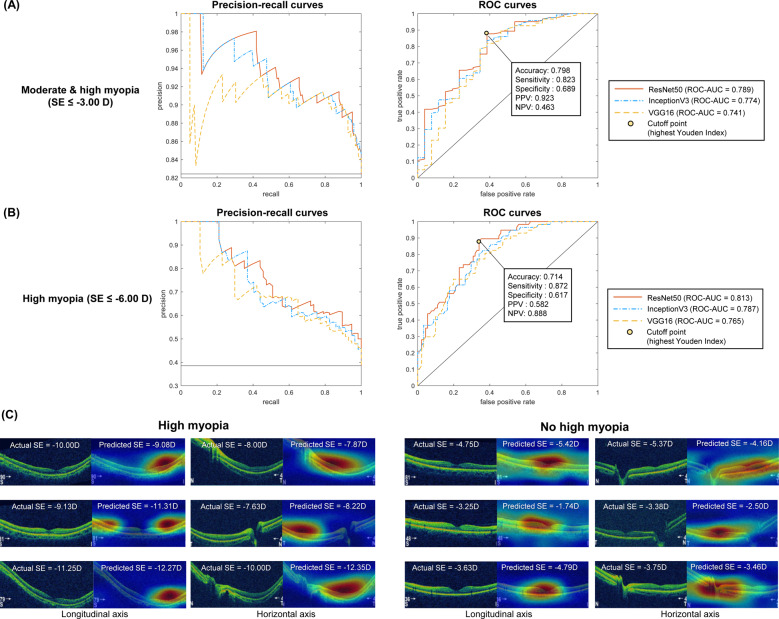
Fig. 3. Classification performance of deep learning models with horizontal OCT images to detect myopia in the test dataset validation.
A Precision–recall curves and ROC curves for moderate myopia and worse (SE ≤ −3.00 D) and B for high myopia (SE ≤ −6.00 D). C Examples of the developed deep learning (ResNet50) results predicting the uncorrected refractive error with a saliency map using the Grad-CAM technique.

