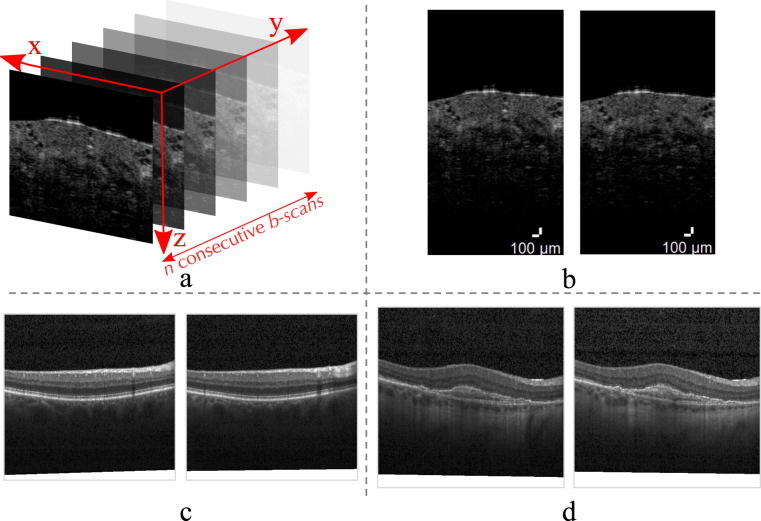
Fig. 1.
Schematic of an OCT volume with examples of consecutive slices (b-scans) from the three open-access OCT datasets used in this study. In (a) consecutive 2D b-scans rendering a 3D OCT volume are pictured. Here an example from the AIIMS dataset14 is used for illustrative purposes. In (b) the consecutive b-scans separated by ~18 micrometers are examples of healthy breast tissue (Patient 15, volume 0046, slices 0075 and 0076) from the AIIMS dataset14. In (c) images of healthy retina from Srinivasan’s dataset16 (folder NORMAL5 slices 032 and 033) can be seen. In (d) consecutive images of retina affected by choroidal neovascularization (CNV 81630-33 and 81630-34) from the Kermany’s OCT2017 version 2 dataset15 are shown. Note that the b-scans from both Kermany’s and Srinivasan’s datasets are given with data augmentation originally applied.

