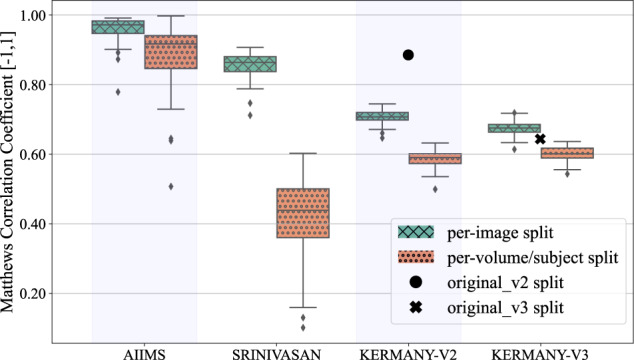
Fig. 2.

Comparison between Matthews Correlation Coefficient for LightOCT model trained on different dataset split strategies. Each box plot summarizes the test MCC for the 50 models trained through a ten-times repeated five-fold cross validation. Results are presented for all the four datasets with the per-image split strategy shown in striped-green and per-volume/subject split strategy in dotted-orange. For Kermany’s datasets, the result of the models trained on the original_v2 and original_v3 splits are shown as full-black circle and full-black cross, respectively. Outliers are shown as diamond (♦).
