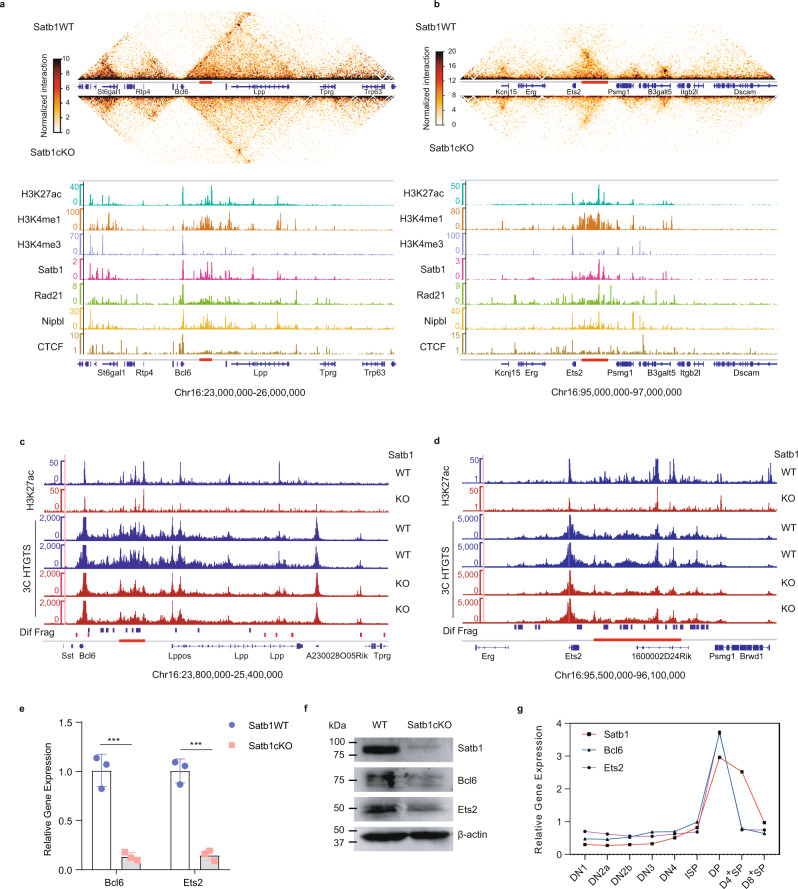
Fig. 5. SATB1 regulates transcription factors Bcl6 and Ets2 by mediating promoter–enhancer interactions.
a, b In situ Hi-C chromatin interaction heatmaps (up) of Satb1WT and Satb1cKO DP thymocytes for the Bcl6 (a) and Ets2 locus (b). H3K27ac, H3K4me1, H3K4me3, Satb1, Rad21, Nipbl, and CTCF ChIP-seq tracks (bottom) of Satb1WT cells for each locus. ChIP-seq data are same as Fig. 2c. c, d ChIP-seq and 3C-HTGTS at the Bcl6 and Ets2 loci. The 3C-HTGTS bait is at the Bcl6 or Ets2 promoters. e Relative expression of Bcl6 and Est2 in Satb1WT and Satb1cKO DP thymocytes detected by reverse-transcripted quantitative PCR. The expressions are normalized to the Actb gene and then to WT. n = 3 for each group, Bcl6, P = 0.0009; Ets2, P = 0.0004. The data represent mean ± SD of three experiments. ***P value <0.001 by two-sided Student’s t test. f Western blot showing protein expression of Satb1, Bcl6, and Ets2 in WT and Satb1cKO thymocytes. β-actin was used as an internal control. g The expression profiles of Satb1, Bcl6, and Ets2 during the differentiation of DN1 into DP thymocytes. Source data are provided as a Source Data file.

