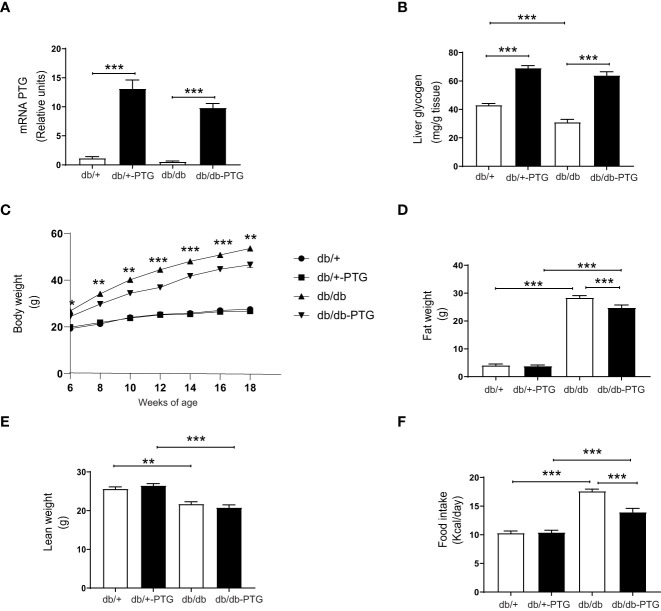
Figure 1.
Liver PTG overexpression decreases body weight and food intake in db/db mice. (A) Relative mRNA of PTG in the liver, (B) Liver glycogen content, (C) Growth curve from 6-18 weeks of age, (D) Fat weight, (E) Lean weight, and (F) Daily food intake of db/db and db/db-PTG mice, and non-diabetic controls (n=6-12 in all experiments except food intake n=18-26). All values are mean ± SEM. *P<0.05, **P<0.01, ***P<0.001. For figure (A) Diabetes factor (F ratio=4.090, P=0.0540), PTG factor (F ratio=123.5, P<0.0001), Interaction (F ratio=1.963, P=0.1734). For figure (B) Diabetes factor (F ratio=20.81, P<0.0001), PTG factor (F ratio=243.8, P<0.0001), Interaction (F ratio=3.354, P=0.0777). For figure (C) 6 weeks of age Diabetes factor (F ratio=43.79, P<0.0001), PTG factor (F ratio=2.250, P=0.1456), Interaction (F ratio=5.106, P=0.0325). For figure (C) 8 weeks of age Diabetes factor (F ratio=119.5, P<0.0001), PTG factor (F ratio=3.982, P=0.0566), Interaction (F ratio=8.517, P=0.0072). For figure (C) 10 weeks of age Diabetes factor (F ratio=175.3, P<0.0001), PTG factor (F ratio=8.286, P=0.0079), Interaction (F ratio=8.461, P=0.0073). For figure (C) 12 weeks of age Diabetes factor (F ratio=327.4, P<0.0001), PTG factor (F ratio=19.51, P=0.0002), Interaction (F ratio=20.02, P=0.0001). For figure (C) 14 weeks of age Diabetes factor (F ratio=467.6, P<0.0001), PTG factor (F ratio=94.71, P=0.0004), Interaction (F ratio=13.08, P=0.0013). For figure (C) 16 weeks of age Diabetes factor (F ratio=529.7, P<0.0001), PTG factor (F ratio=20.50, P=0.0001), Interaction (F ratio=15.65, P=0.0005). For figure (C) 18 weeks of age Diabetes factor (F ratio=442.1, P<0.0001), PTG factor (F ratio=9.595, P=0.0046), Interaction (F ratio=7.617, P=0.0105). For figure (D) Diabetes factor (F ratio=1620, P<0.0001), PTG factor (F ratio=11.46, P=0.0017), Interaction (F ratio=14.32, P=0.0005). For figure (E) Diabetes factor (F ratio=62.29, P<0.0001), PTG factor (F ratio=0.4716, P=0.4964), Interaction (F ratio=6.722, P=0.0134). For figure (F) Diabetes factor (F ratio=128.8, P<0.0001), PTG factor (F ratio=13.47, P=0.0004), Interaction (F ratio=15.02, P=0.0002).

