FIGURE 4.

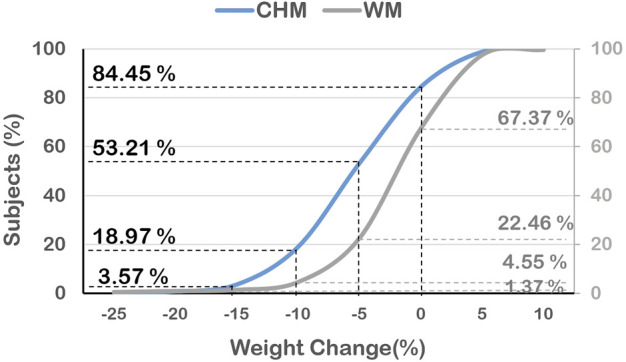
The differences in distribution of the percentage of reduced body weight among obese subjects at day 180 between CHM and WM users.

The differences in distribution of the percentage of reduced body weight among obese subjects at day 180 between CHM and WM users.