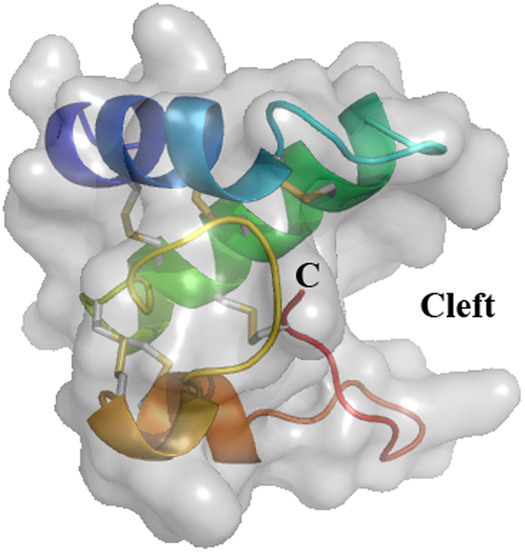
Figure 2.

Three-dimensional structure of snakin-1 (PDB 5E5Q). Ribbon representation with surface obtained from crystallography data show three α-helices colored in blue (S2–C13), green (L18–K34), and orange (N43–E46 and C47–K53). The cleft is indicated where a putative ligand could bind. The six disulfide bridges are shown in gray/yellow small bars. C: C-terminal end of the protein. N-terminal is masked by the first α-helix (dark blue).
