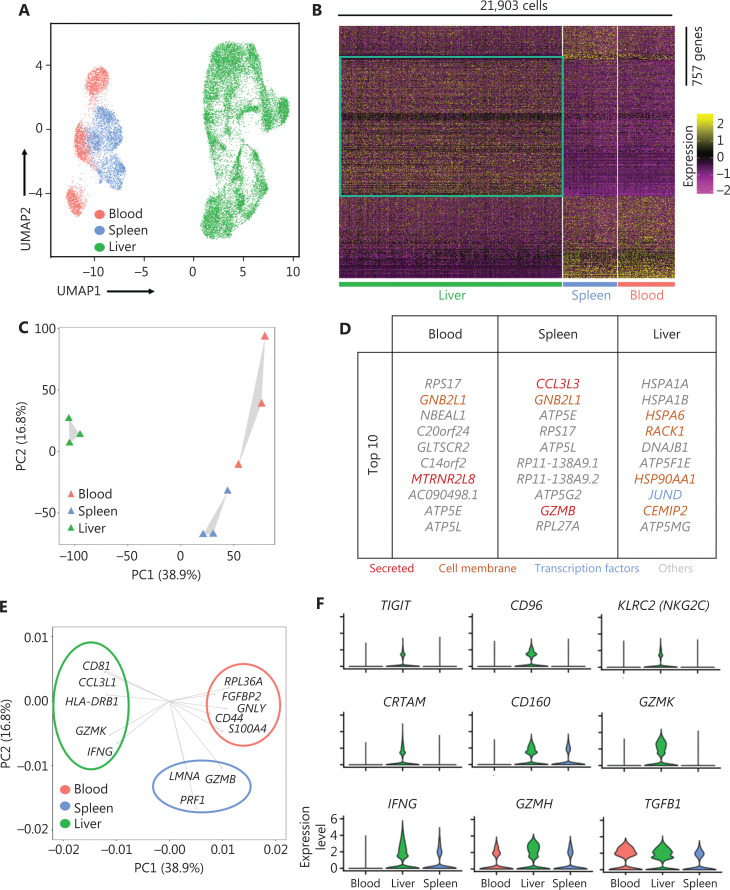
Figure 2.
Liver NK cells are highly distinct from spleen and peripheral blood NK cells. (A) UMAP plot of healthy donor NK cells from human blood (red, 3,763 cells), spleen (blue, 3,543 cells), and liver (green, 14,597 cells) samples. (B) Heatmap of 757 informative genes for distinguishing human blood (213 genes), spleen (189 genes), and liver (355 genes) NK cells. Cells are plotted in columns by organ source, and genes are shown in rows, ranked by adjusted P value < 0.05 (Wilcoxon rank sum test). Gene expression is color coded with a scale based on z-score distribution, from −2 (purple) to 2 (yellow). (C) PCA for the 3 human organ NK cell subsets from each sample, according to the mean expression of the genes. Each triangle represents 1 sample, colored by organ. (D) Top 10 genes significantly differentially expressed among the 3 human organ NK cell subsets. Genes are ranked by log2 fold-change. (E) Genes driving human blood, spleen, or liver NK cell identity (according to the loading value), colored by cell origin. (F) Expression distribution (violin plots) in each population (horizontal axes), for known NK cell genes.

