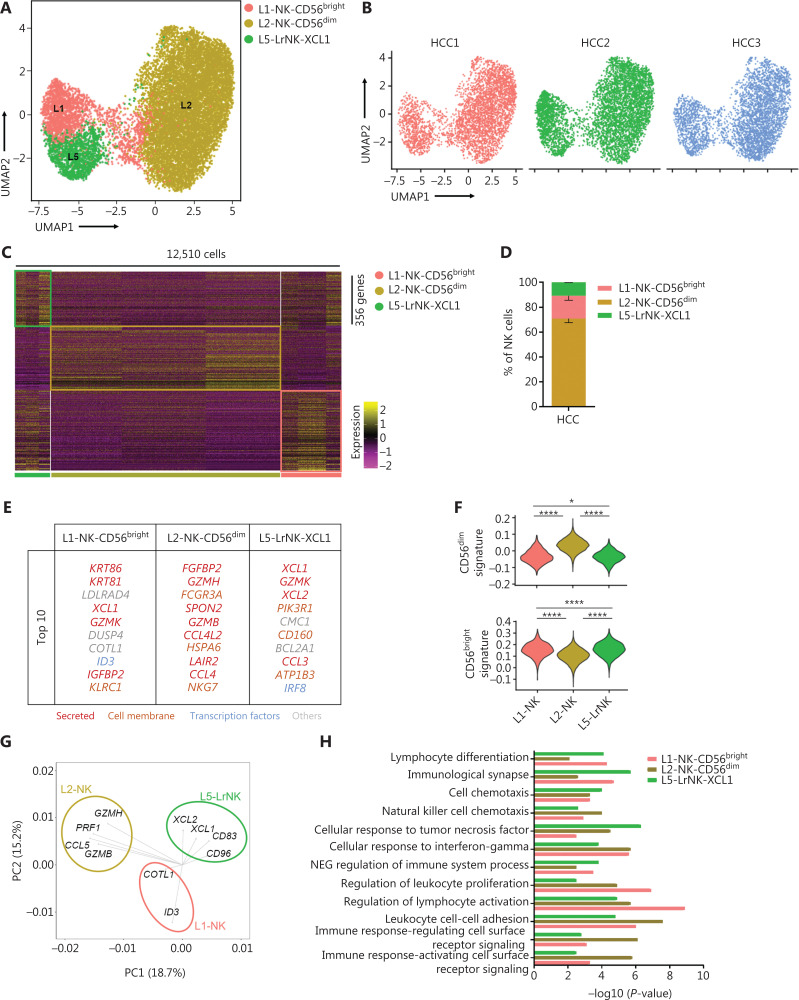
Figure 4.
High-throughput scRNA-seq identifies 3 NK cell subsets in liver cancer. (A) UMAP projection of NK cells from 3 patients with HCC, showing 3 main subsets (in different colors). The putative functional description for each subset is based on the characteristic gene expression profiles of each subset. (B) UMAP plot of human liver NK cells from tumor infiltrating cells, colored by patient (HCC1: 3,902 cells; HCC2: 4,799 cells; and HCC3: 3,809 cells). (C) Heatmap of the 356 genes tested with a Wilcoxon rank sum test separating the 12,510 HCC-infiltrating NK cells into 3 main subsets shown in different colors. Squares identify specific transcriptomic signatures of different cell subsets. (D) The fractions of 3 subsets defined among NK cells in 3 patients with HCC across all liver NK cells. (E) Top 10 genes significantly differentially expressed among the 3 liver NK subsets. Genes are ranked by log2 fold-change. (F) Module scores of CD56dim and CD56bright gene expression programs defined by Hanna et al.43. Violin plots representing the distribution of module scores for CD56dim (top) CD56bright (bottom) for each liver NK cell subset (Kruskal-Wallis ANOVA followed by Dunn’s multiple comparisons test). *P < 0.05; ****P < 0.0001. (G) PCA for the driving genes of 3 liver NK cell subsets from HCC. (H) Selected Gene Ontology terms using genes upregulated (log2 fold-change > 0.25) within each subset with an adjusted P < 0.05.

