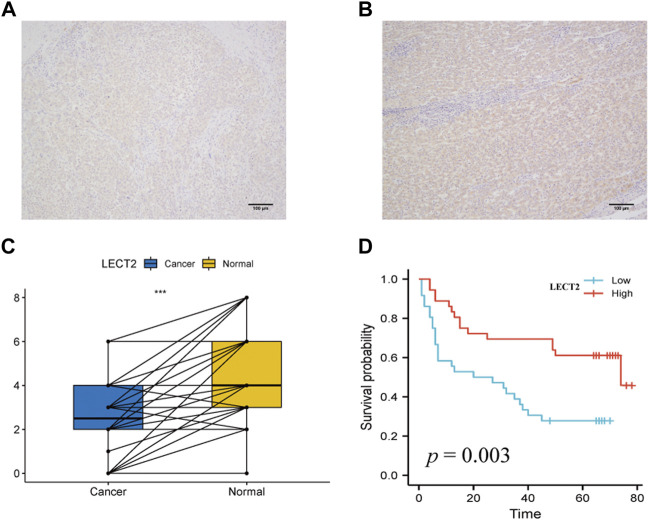
FIGURE 4.
Expression levels and prognostic analysis of LECT2. (A–B) Representative IHC maps of LECT2 expression in HCC tissues and adjacent normal tissues (C) The expression levels of LECT2 in 72 cases of HCC and normal tissues, blue represents HCC tissue, yellow represents adjacent normal tissues (D) The prognostic analysis of LECT2 in 72 cases of HCC.

