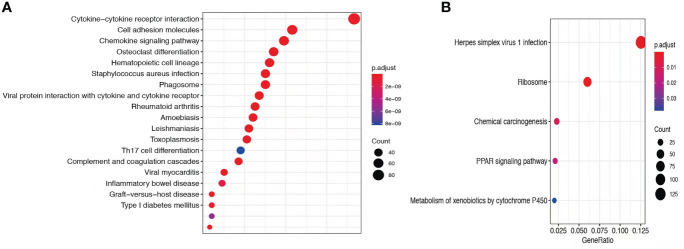
Figure 3.
Comparative transcriptome sequencing of patient 1. (A) Up-regulated DEGs in P1 were enriched antifungal immune pathways. (B) Dot diagram showed the enriched pathways in P1. Color of nodes corresponding to significant levels. Size of nodes represented the number of genes in certain pathway.

