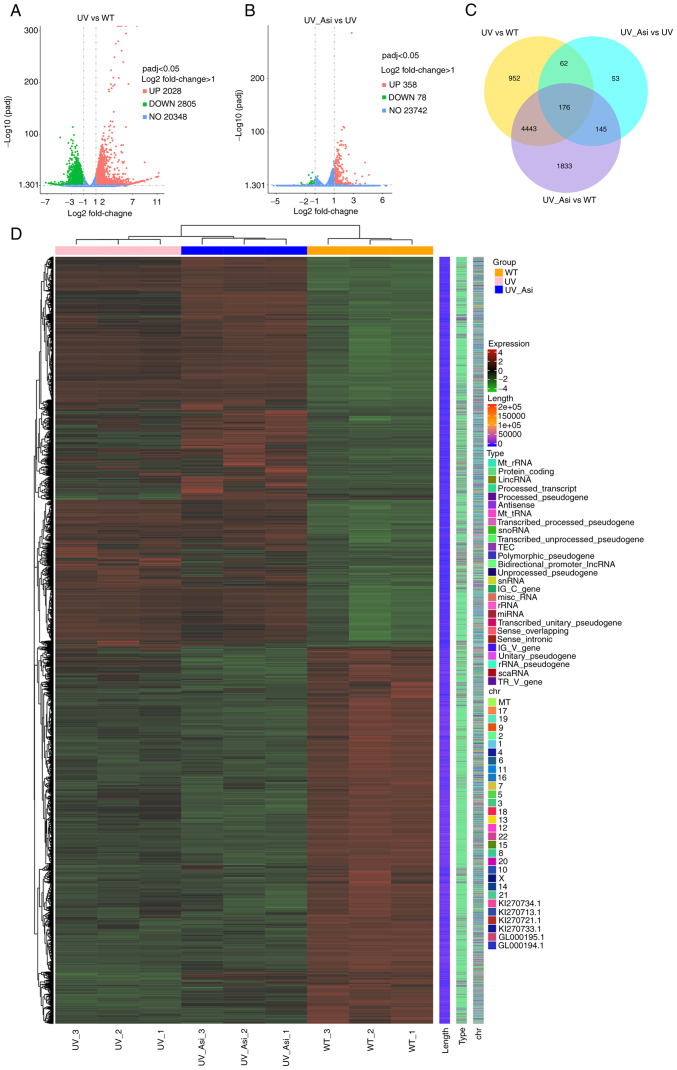
Figure 5.
Visualization of enriched genes which have significant difference upon treatments. (A) Clustered genes in UV group compared with WT group. (B) Clustered genes in asiaticoside treated group compared with UV group. (C) Venn diagram of number of differential genes. (D) Heatmap of enriched genes among three groups. UV, ultraviolet; WT, wildtype; Asi, asiaticoside.

