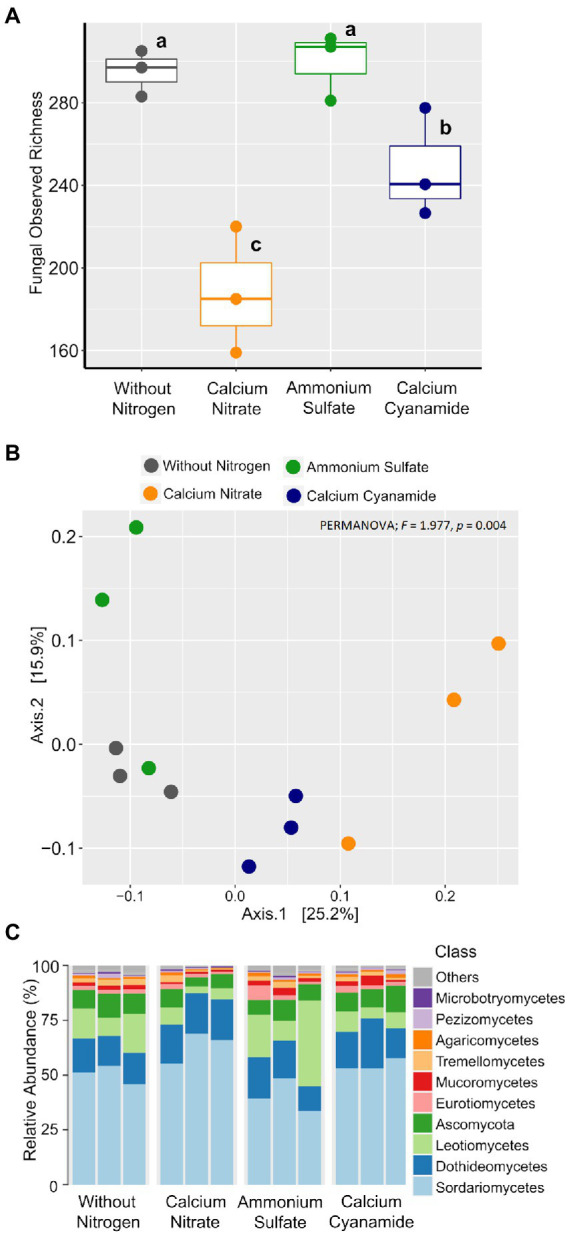
Figure 6.

Box plots of the fungal observed richness. (A) Principal coordinates analysis (PCoA) based on Bray–Curtis dissimilarity. (B) Colors: without nitrogen, black; calcium nitrate, orange; ammonium sulfate, green; calcium cyanamide, blue. Effects of N fertilization were tested with PERMANOVA (based on Hellinger transformed data and the Bray–Curtis distance measure). (C) Mean relative abundance of the main classes of the fungal communities detected. The different lowercase letters indicate significant differences at 0.05 probability level according to Tukey multiple comparison test.
