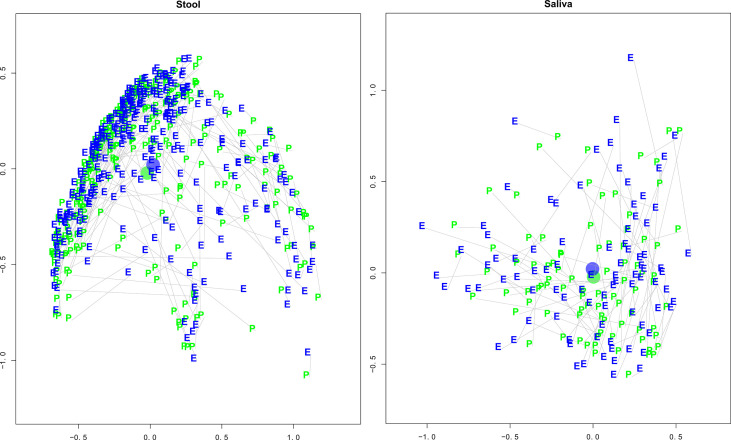
Figure 2.
Stool and Saliva Pre- and Early Pandemic Paired MDS plots. These multi-dimensional scaling (MDS) plots illustrate each subject’s taxonomic compositional similarity between pre- and early pandemic samples in context with the samples of the cohort. The left and right panels represent the intra-cohort separation of stool and saliva samples, respectively. The green “pre” and blue “early” labels indicate the MDS estimated locations of pre- and early pandemic samples, respectively. A grey line connects pre- and early pandemic samples from the same subject. The blue and green circles represent the centroids of the pre- and early pandemic samples. After controlling for questionnaire responses, the bootstrapped regression identified that pre- vs early pandemic samples had a statistically significant separation (coef = 1.1404, p-val < 0.0001), but saliva did not (coef = 0.1421, p-val = 0.8461).

