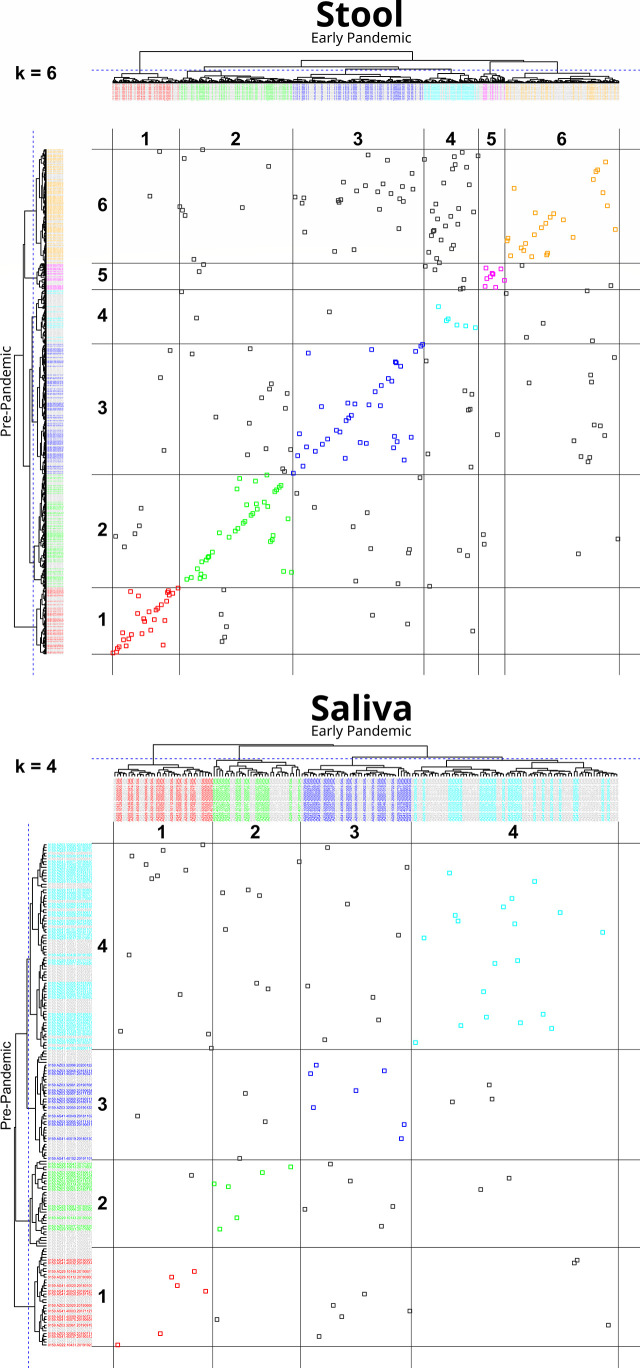
Figure 3.
Cluster transition plot for Stool at k=6 and Saliva at k=4. Cluster transition plots provide a visualization of the degree to which an early pandemic sample’s composition has changed relative to its pre-pandemic composition to warrant a change in its cluster membership. Hierarchical clustering and tree cutting (to form discrete clusters) is inherently an iterative process. In this figure, only one slice at k = 6, for stool, and k = 4, for saliva (labeled on the top left of each plot), were selected for illustrative purposes, although cuts k from 2 to 7 were also calculated. The dendrogram from hierarchically clustering of pre- and early pandemic samples are drawn on the top and left margins. The left margin dendrogram have pre-pandemic samples colored by their cluster identifier, while early pandemic samples are colored grey. Similarly, but complementarily, the top margin dendrogram has early pandemic samples colored by cluster identifier, but pre-pandemic samples are colored grey. In the field of the plot, each point represents the intersection of pre- and early pandemic samples. If both pre- and early pandemic samples are in the same cluster, then they are colored by their cluster identity, otherwise they are colored grey. Gridlines are drawn in the field to help identify cluster boundaries. When pre- to early pandemic samples have changed less in their composition, their points will be colored and lie across a diagonal from bottom-left to top-right. Examples of noteworthy observations from the stool transition plot includes the number of pre-pandemic cluster 6 (Bacteroides and Escherichia Shigella) members that have moved into cluster 4 (Bacteroides, Faecalibacterium) early pandemic, or that none of the pre-pandemic members of cluster 1 (Prevotella, Prevotellaceae, and Lactobacillus) have moved into cluster 6. Comparing the stool and saliva cluster transition plots provides a visualization of the stronger coherence of early pandemic samples to their pre-pandemic counterparts in stool.

