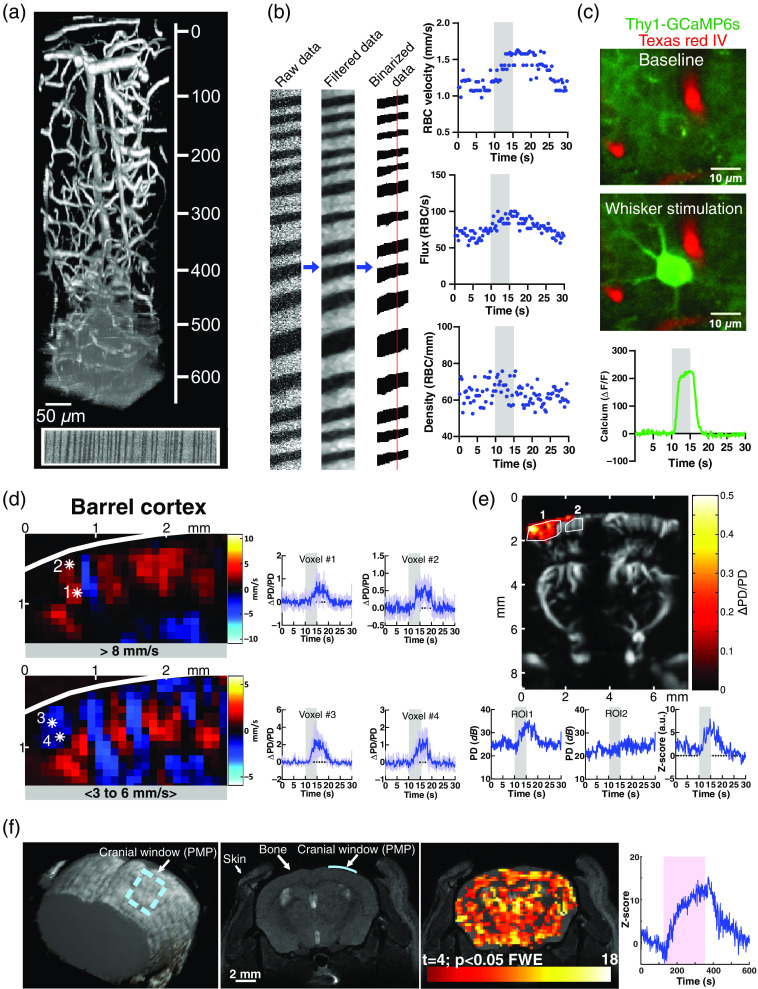
Fig. 3.
Multimodal imaging through the optimized whole cortex PMP chronic window. (a) 3D reconstruction of the cortical vasculature labeled with Texas Red down to and imaged through a -thick PMP sheet (; field of view: ). Bottom: a line scan acquisition at . (b) Left: line scan analysis (filtering and binarization) allows to extract red blood cell velocity, flux, and linear density. The vertical red line indicates the site of flow measurement. Right: whisker stimulation (5 s, 5 Hz) increases velocity and flux, not linear density (barrel cortex capillary, depth). (c) Calcium response of a pyramidal cell to 5 s whisker stimulation (5 Hz, depth) in a Thy1-GCAMP6s mouse. (d) Left: color Doppler map of the barrel cortex in response to a whisker stimulation (5 s, 5 Hz). Colors represent the direction of flow using either a filter for high axial velocities (top image, ) or intermediate axial velocities (bottom image, to ). Red and blue colors report CBV flowing away or toward the probe, respectively. Right: graphs showing responses (mean ± SD of four consecutive whisker responses) of the single voxels indicated by stars (left). Mean contrast-to-noise ratio (CNR) of voxel 1 to 4, respectively; , , , and . (e) Top: activation map () superimposed on the Doppler image in response to a single whisker stimulation (5 s, 5 Hz). Bottom: graphs showing the PD response of the activated area (ROI1), the neighboring region (ROI2), and the ratio = (PD ROI1−PD ROI2)/SD ROI1). (f) Left: 3D reconstruction of 2D RARE images. The dotted blue rectangle and the blue line on top of the cortex points to a PMP window (the PMP and the bone are not visible), which small size allowed to reveal the absence of MRI artifact in RARE acquisitions (left and middle images), as well as during a BOLD functional response (Right, T2*-weighted GE EPI acquisition, response to 100% oxygen, 240 s). Right: -score of the BOLD signal.

