
Figure 5.
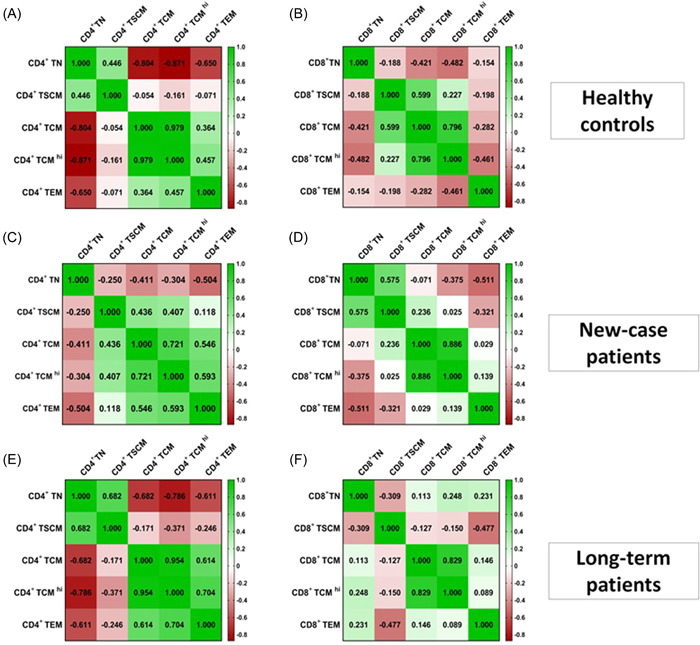
The correlation between CD4+and CD8+T cell subsets with each other in all study groups. (A) Heat map correlation of CD4+ T cell populations with each other in healthy controls. (B) Heat map correlation of CD8+ T cell populations with each other in healthy controls. (C) Heat map correlation of CD4+ T cell populations with each other in new‐case (NC) patients. (D) Heat map correlation of CD8+ T cell populations with each other in NC patients. (E) Heat map correlation of CD4+ T cell populations with each other in long‐term (LT) patients. (F) Heat map correlation of CD8+ T cell populations with each other in LT patients (green: positive correlation, red: negative correlation). The p‐value and R were determined according to Spearman's rank correlation test.