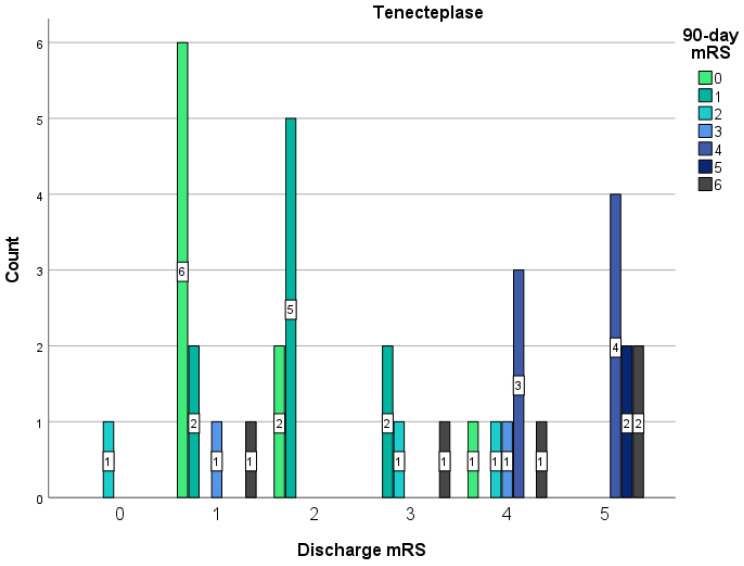
Figure 1.
Distribution of the discharge mRS and the 90-day mRS between patients treated with Tenecteplase. Shown is the distribution of scores for disability on the modified Rankin Scale (which ranges from 0 to 6, with higher scores indicating more severe disability, and 6 indicating death) among patients in the Tenecteplase group during discharge and after 90 days. The bars indicate the mRS results after 90-days. The numbers in the bars are the count of patients who had each score after 90-days.

