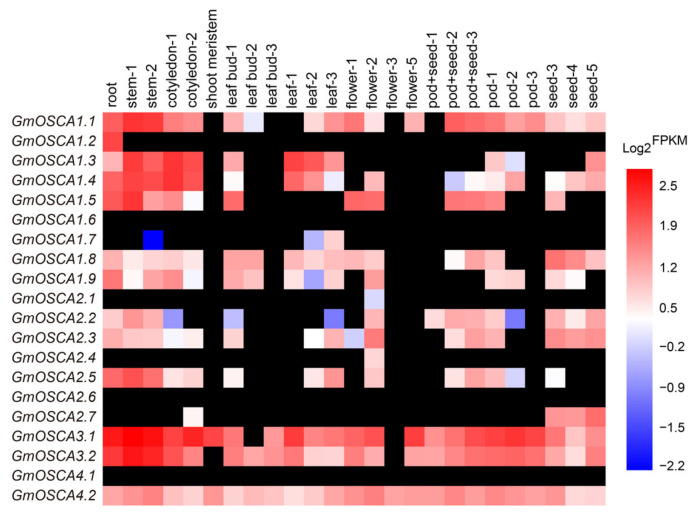
Figure 2.
The spatiotemporal expression profiles of GmOSCA genes in soybean. The size number behind each sample indicated earlier to later developmental stages with the same sample. Gradient color blocks represented log2-transformed FPKM values. The black blocks indicated that no FPKM value was available.

