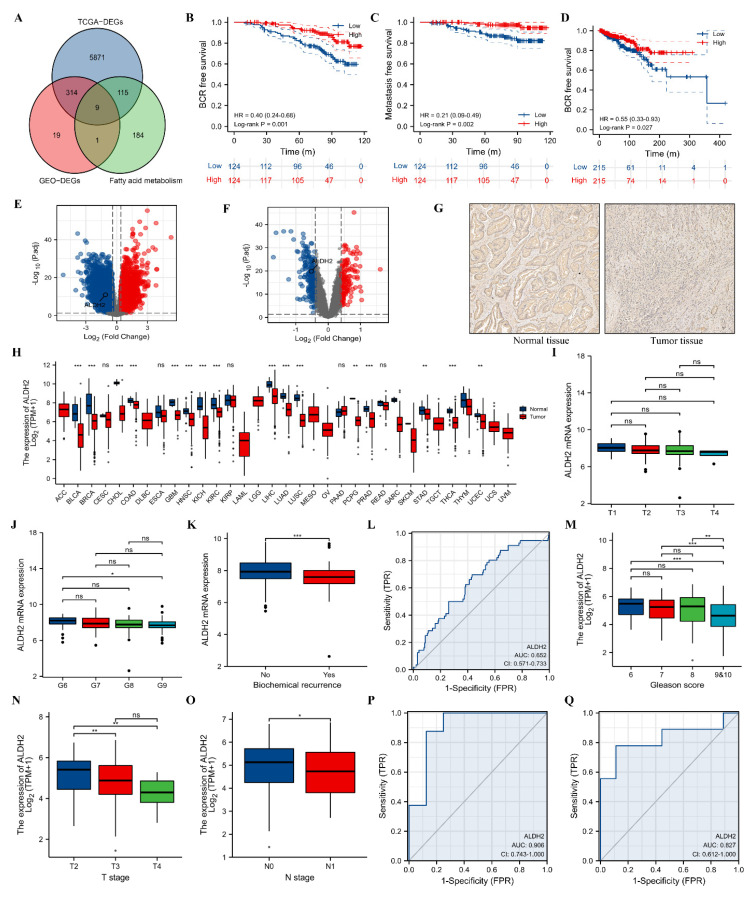
Figure 1.
The clinical values of ALDH2 in prostate cancer. (A) Venn plot showing through the intersection of DEGs of TCGA database and GEO datasets, and gene sets of fatty acid metabolism; (B) Kaplan–Meier curve of ALDH2 for BCR-free survival; (C) Kaplan–Meier curve of ALDH2 for metastasis-free survival; (D) Kaplan–Meier curve of ALDH2 for BCR-free survival in TCGA database; (E) volcano plot showing DEGs in TCGA database; (F) volcano plot showing DEGs in GEO datasets; (G) differential expression of ALDH2 between tumor and normal tissues at protein level; (H) differential mRNA expression of ALDH2 between tumor and normal sample at pan-cancer level in TCGA database; (I) comparison between ALDH2 and T stages; (J) comparison between ALDH2 and Gleason score; (K) comparison between ALDH2 and BCR; (L) ROC curve of ALDH2 discriminating BCR from no BCR; (M) comparison between ALDH2 and Gleason score in TCGA database; (N) comparison between ALDH2 and T stages in TCGA database; (O) comparison between ALDH2 and N stages in TCGA database; (P) ROC curve of discriminating drug resistance from drug sensitivity; and (Q) ROC curve of discriminating radiation resistance from radiation sensitivity. DEG = differentially expressed genes; BCR = biochemical recurrence; ROC= receiver operating characteristic curve. ns, 0.05; *, 0.05; **, 0.01, and ***, 0.001.

