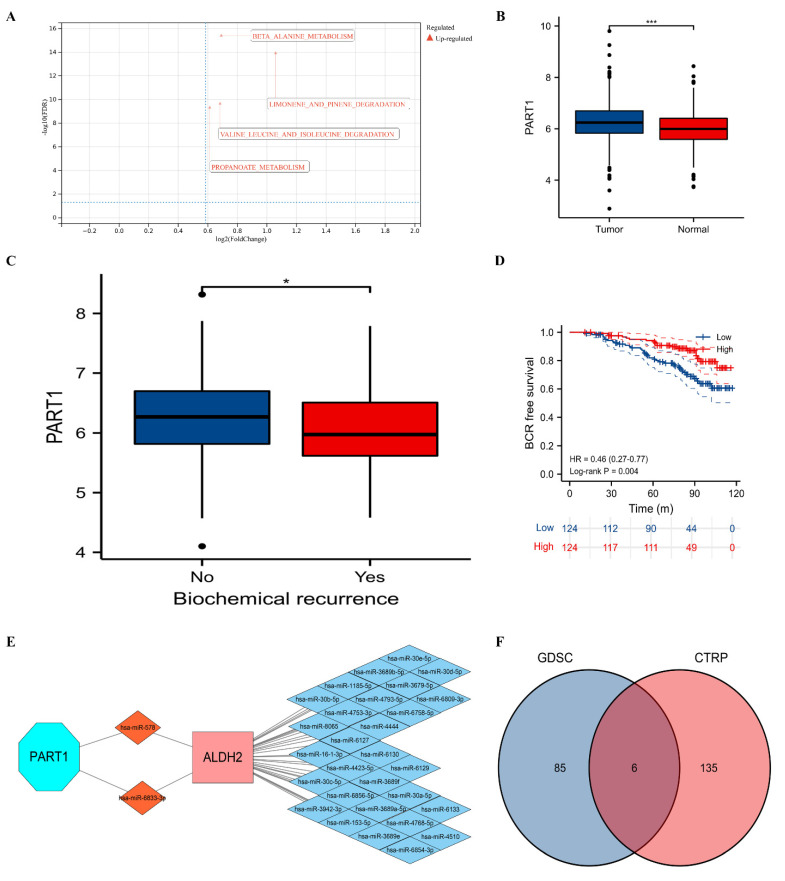
Figure 3.
Functional enrichment analysis, ceRNA network, and drug analysis. (A) Gene set enrichment analysis; (B) comparison between tumor and normal groups for PART1; (C) comparison between BCR and no BCR groups for PART1; (D) Kaplan–Meier curve of PART1 for BCR-free survival; (E) ceRNA network; and (F) Venn plot showing the commonly sensitive drugs to ALDH2. ceRNA = competing endogenous RNA; BCR = biochemical recurrence. ns, 0.05; *, 0.05; and ***, 0.001.

