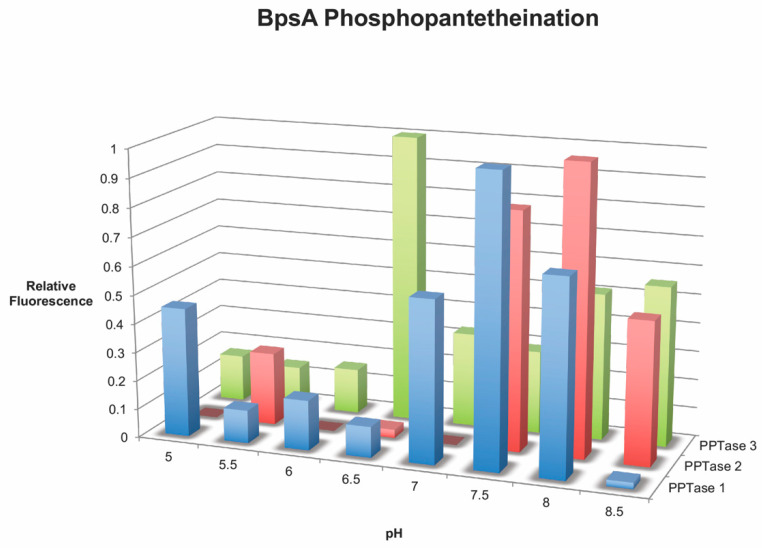
Figure 2.
Phosphopantetheination of the BpsA reporter at various pH values. The graph shows the amount of phosphopantetheination of the wild-type BpsA reporter by each of the three Amphidinium carterae phosphopantetheinyl transferases. The relative fluorescence produced by the free thiol detection kit on the Y-axis as a function of pH in the reaction on the X-axis is indicative of the amount of phosphopantetheinate added to the BpsA protein by each phosphopantetheinyl transferase labeled on the Z-axis.

