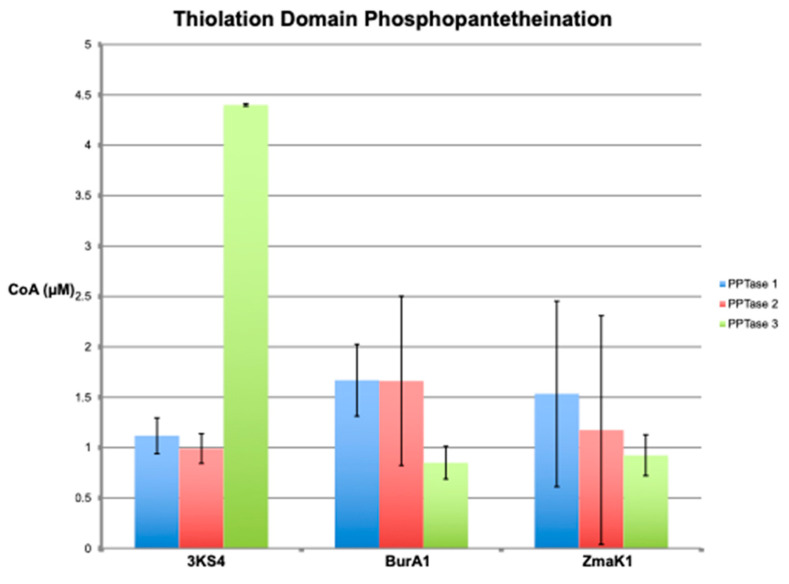
Figure 3.
Phosphopantetheination of thiolation domains detected as free thiol. The graph shows the amount of phosphopantetheination of BpsA containing thiolation domain four from the triple KS transcript (3KS4), thiolation domain one from the BurA-like transcript (BurA1), and thiolation domain one from the ZmaK-like transcript (ZmaK1) described on the X-axis. The amount of phosphopantetheination is given as the resultant micromolar amount of CoA added to the 8 µM of starting BpsA protein. Error bars show the standard deviation of triplicate reactions for the Clade one, two and three PPTases colored blue, red and green, respectively.

