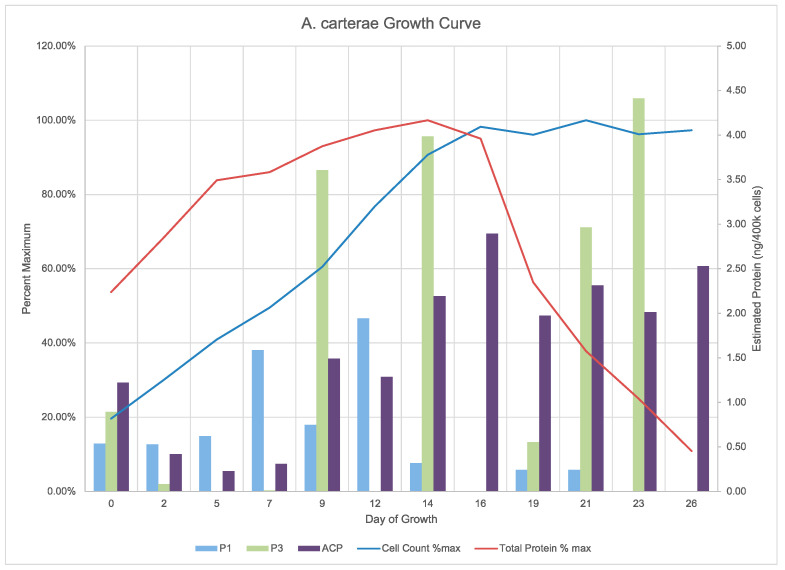
Figure 6.
Amphidinium carterae growth curve cell counts and protein quantities. The graph shows the growth and protein measurements for an axenic Amphidinium carterae culture with CO2 addition. The cell counts (blue line) and total protein (red line) are shown as a percent of maximum on the left Y-axis while the western blot quantifications for the acyl carrier protein (ACP, purple) as well as the clade one and three PPTases (P1 blue, P3 green, respectively) are shown on the right Y-axis as an estimate of protein in ng/400k cells. The day of growth for each sample is shown on the X-axis.

