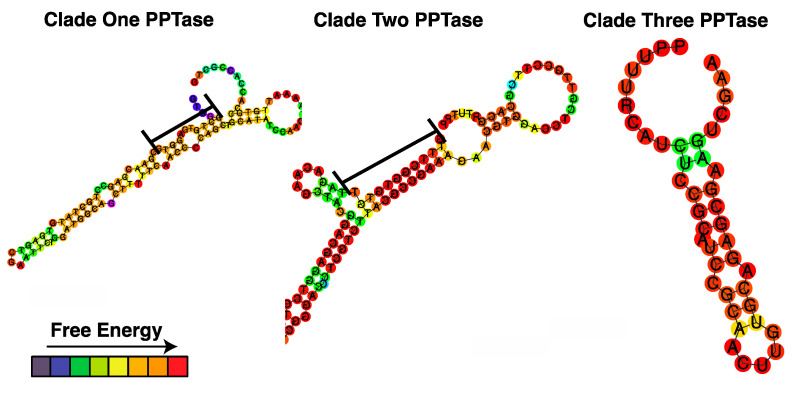
Figure 9.
Folding structure of the Amphidinium carterae phosphopantetheinyl transferase 3′ untranslated regions. The 2-dimensionally rendered folding structure of the 3′ untranslated regions from the A. carterae phosphopantetheinyl transferases are shown. The colors indicate the relative free energy of each nucleotide from low in blue to high in red. Stem regions rich in guanidine and thymidine nucleotides are highlighted with a black bar.

