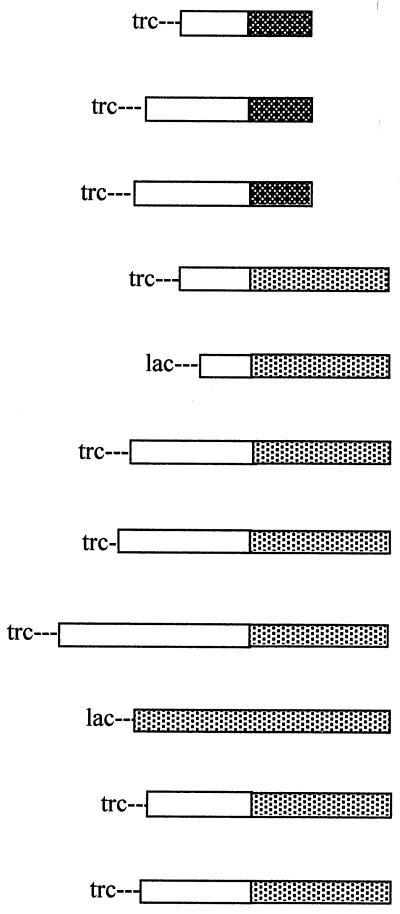
TABLE 4.
Secretion of hybrid constructions in E. coli
| Plasmid-signal | Promoter-hybrid gene structurea | Sizes of hybrid proteins (split in moieties)b | Total sizec (in kDa) | No. of SH groups | Secretion (%)d of E. coli |
|---|---|---|---|---|---|
| pSE420-93CTP |  |
46/93 | 16.7 | 1 | 0 |
| phEPO-93CTPB | 167/93 | 31.2 | 4 | 0 | |
| ptGH-93CTPB | 189/93 | 33.8 | 4 | 0 | |
| pSE420-181CTPB | 48/181 | 27.5 | 1 | 27–31 | |
| p-βGal-181CTPB | 30/181 | 25.3 | 0 | 60–75 | |
| pOmpC-181CTPB | 204/181 | 46.0 | 0 | 24–48 | |
| pGFP-181CTPB | 238/181 | 55.3 | 2e | 32–56 | |
| pCHIT-181CTPB | 424/181 | 72.6 | 0 | 4–8 | |
| pRUW500 (PrtB) | 466f | 56.0 | 0 | 98–100 | |
| phEPO-181CTPB | 167/181 | 41.7 | 4 | 0 | |
| ptGH-181CTPB | 189/181 | 44.4 | 4 | 0 |
Hybrid size structures represented by horizontal bars are not drawn to scale.
Hybrid sizes are displayed in amino acid residues as separated contributions of the passenger protein and the corresponding CTPB region.
Molecular mass was estimated considering an average mass of 120 Da per amino acid residue.
Data were obtained for two independently isolated clones, and values were not averaged. All secretion assays required introduction of plasmid pRUW4 by electroporation. Secretion was determined by scanning Western blot bands of hybrids detected with anti-protease B antibodies and expressed as a percentage of the supernatant fraction compared to total amount of the synthesized hybrid. Data were processed by the Image J V1.12 program (Wayne Rasband, National Institutes of Health).
Not a disulfide bond.
The entire E. chrysanthemi protease B gene as a positive secretion control (not a hybrid).
