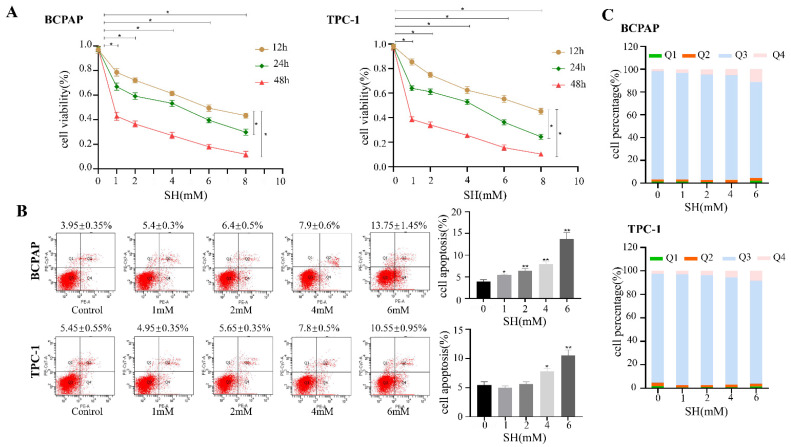
Figure 1.
SH-inhibited cell proliferation and induced cell apoptosis in thyroid cancer cells. (A) To evaluate the effect of SH on cell proliferation, different thyroid cancer cell lines were treated with different doses (0, 1, 2, 4, 6, 8 mM) of SH for the indicated times (12 h, 24 h, 48 h). (B) Cell apoptosis was evaluated using flow cytometry when the indicated cells were treated with SH at different concentrations (0, 1, 2, 4, 6 mM) for 24 h. Apoptosis (%) represents the sum of early apoptotic and late apoptotic cells. (C) The percentage of live, early, and late apoptotic and necrotic cells. Q1: necrotic cells; Q2: late apoptotic cells; Q3: live cells; Q4: early apoptotic cells. The data are presented as the means ± SD of three independent experiments which are expressed as fold increase over control. * p < 0.05. ** p < 0.005. SH: sinomenine hydrochloride.

