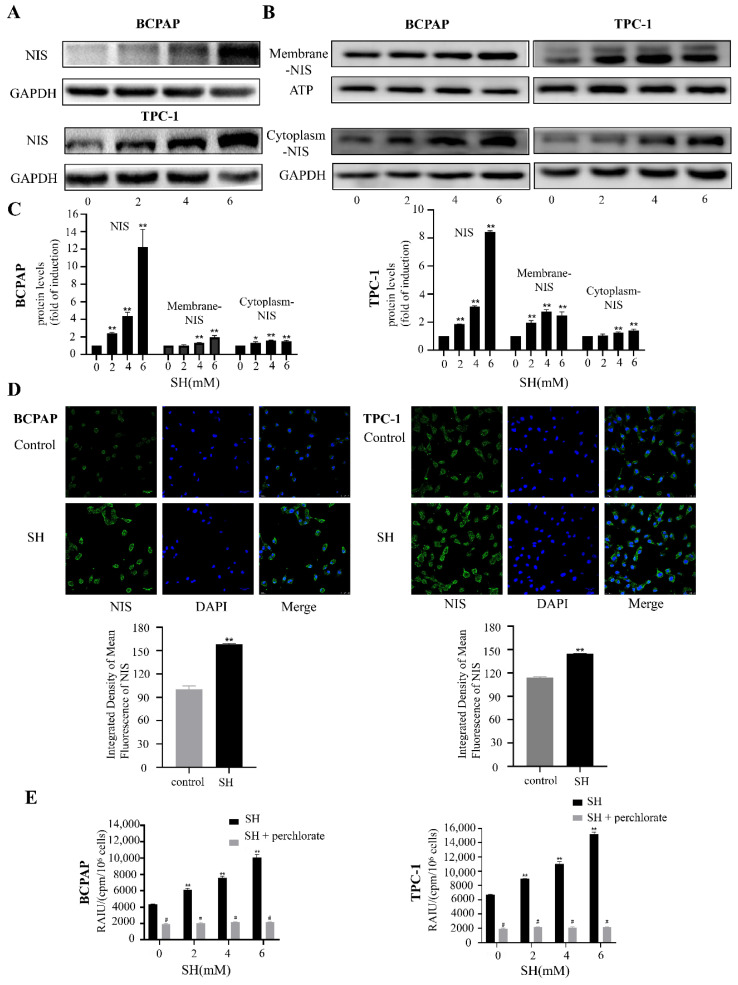
Figure 3.
SH upregulated expression and plasma membrane localization of NIS and increased RAI uptake in BCPAP and TPC-1 cells. (A,B) Western blot analysis shows the expression of NIS in whole cell lysates (A), cell membrane (B), and cytoplasmic proteins (B) after 48 h with SH treatment. GAPDH and ATP were used as the loading control. (C) Quantitative analysis of band intensities on Western blots. (D) Immunofluorescence of NIS protein in BCPAP and TPC-1 cells treated with 4 mM SH for 48 h was detected using confocal microscope with high magnification fields (63×). Scale bar represents 25 μm. (E) BCPAP and TPC-1 cells were treated with fixed concentrations of SH (0, 2, 4, 6 mM) for 48 h, followed by 125I uptake assays. In addition, KClO4 was used as a competitive inhibitor of iodide transport. The cells were preincubated with 300 μM KClO4 for 30 min to inhibit 125I uptake, followed by the 125I uptake test. Data are presented as mean ± SD of values. * p < 0.05 vs. control. ** p < 0.005 vs. control. # p < 0.05 vs. relevant group treated by SH only. RAIU: RAI uptake.

