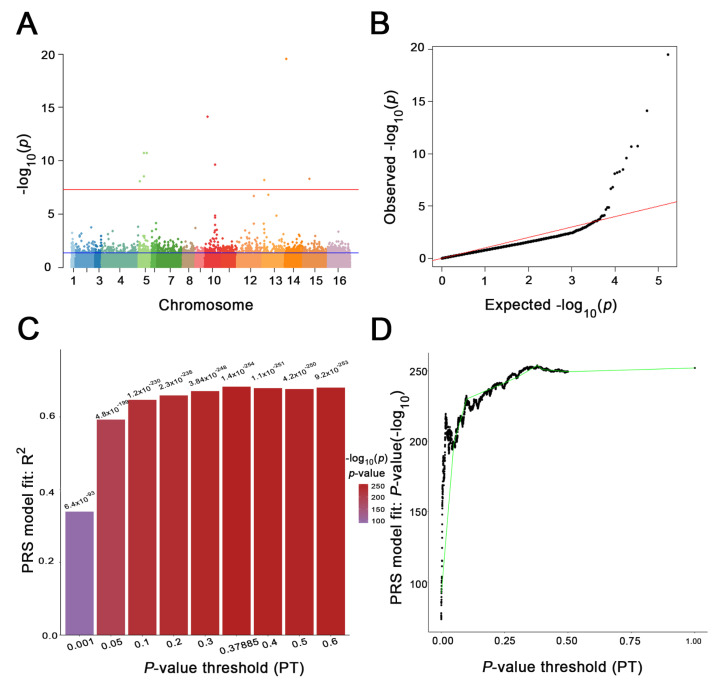
Figure 2.
Genome-wide association study and polygenic risk score prediction of YPD40. (A) the Manhattan plot of GWAS result. The red line indicates that p-value is 5 × 10⁻⁸, and the threshold is statistically significant; the blue line indicates that p-value is 0.37885, and the threshold is the precise p-value threshold (p-value = 0.37885). (B) Quantile–quantile plot showing good normality. (C) Bar plot from PRSice-2 showing results at broad p-value thresholds for PRS predicting YPD40. A bar for the best-fit PRS from the high-resolution run is also included. (D) High-resolution PRSice-2 plot for PRS predictingYPD40. The thick line connects points at the broad p-value thresholds.

