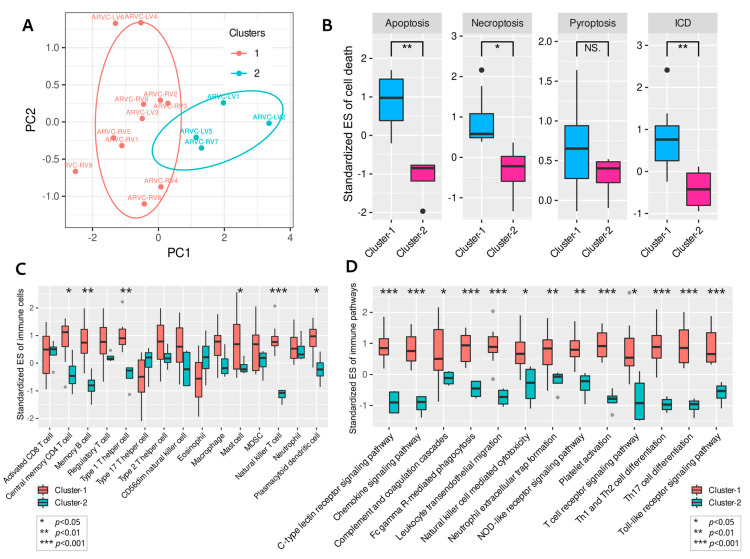
Figure 4.
Clustering of ARVC samples based on the up-regulated cell death processes. (A): Principal component analysis and K-means clustering of the ARVC samples. (B): Comparisons of the four up-regulated cell death processes in ARVC between cluster-1 and cluster-2. (C): Comparisons of the highly infiltrated immune cells in ARVC between cluster-1 and cluster-2. (D): Comparisons of the up-regulated immune pathways in ARVC between cluster-1 and cluster-2. Abbreviations are the same as in Figure 1, Figure 2 and Figure 3. *** p < 0.001; ** p < 0.01; * p < 0.05; NS, non-significance.

