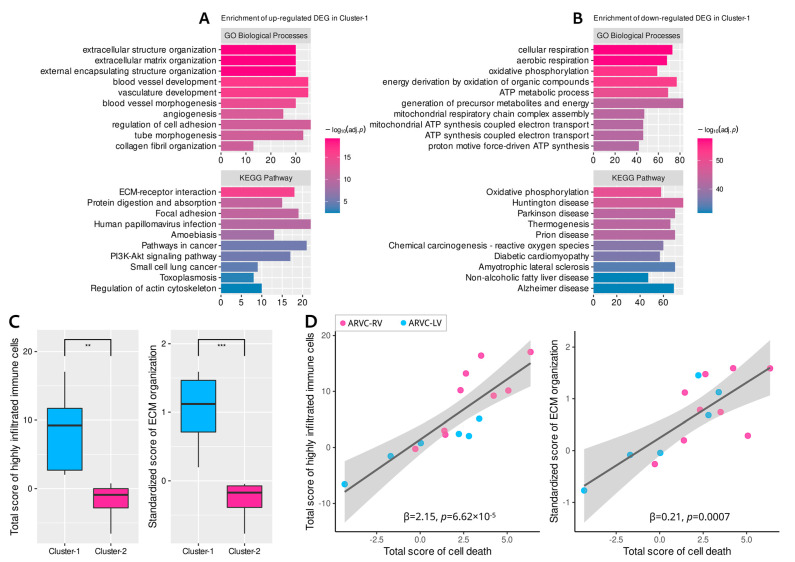
Figure 5.
Enrichment analysis of the differentially expressed genes (DEGs) between the two clusters and functional correlation analysis. (A): Enrichment results of the up-regulated DEGs in cluster-1. (B): Enrichment results of the down-regulated DEGs in cluster-1. (C): Comparisons of the total scores of the highly infiltrated immune cells in ARVC and fibrosis activity (ECM organization) between the two clusters. (D): Positive linear correlations of cell death levels with immune cell infiltration and fibrosis. ECM, extracellular matrix. Other abbreviations are the same as in Figure 1 and Figure 2. *** p < 0.001; ** p < 0.01.

