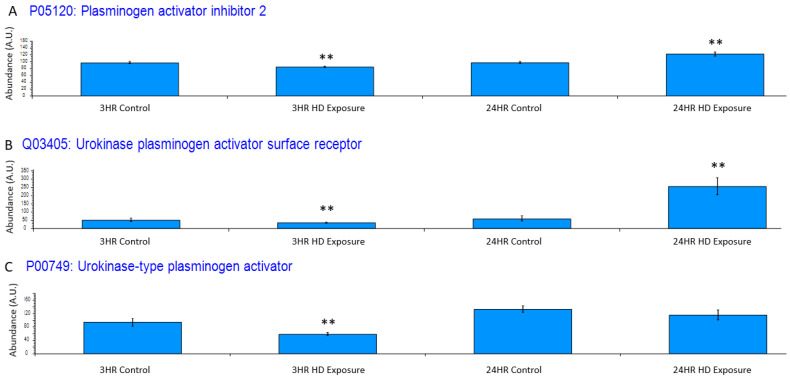
Figure 5.
Bar graphs of the grouped abundances of (A) plasminogen activator inhibitor 2 (PAI2) expression profile across the control groups and the 3 h and 24 h exposures, (B) Urokinase plasminogen activator surface receptor dysregulation at the 3 h and 24 h marks indicating an upregulation in recruitment of urokinase-type plasminogen activator (PLAU) at the 24 h timepoint and initial inflammatory response at associated with the decrease in uPAR. The dysregulation appears to increase post exposure to a point of significant dysregulation, (C) PLAU shows increase expression indicating an inflammatory response. Significant dysregulation (adj. p-value ≤ 0.05) is shown by **.

