
Table 2.
Summary of activities against Mediterranean and Antarctic macro- and micropredators by phylum. Data include samples tested in this study, as well as in previous works, and are shown in percentages. For data from different studies, the mean percentage and standard deviation were calculated. nt: not tested.
| Group/Activity (%) against: | Mediterranean Macropredators (D. arrosor) 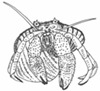
|
Antarctic Macropredators (O. validus) 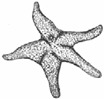
|
Mediterranean Micropredators (Amphipoda: Lyssianasidae) 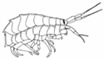
|
Antarctic Micropredators (C. femoratus) 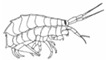
|
|---|---|---|---|---|
| Porifera | 20 1 | 55.2 ± 26.9 11,21,33,44,45 | 100 1 | 100 ± 0 16,21,33 |
| Cnidaria | nt | 80 ± 19.4 11,21,42,45 | 100 1 | 100 ± 0 16,21,42 |
| Annelida | nt | 25 ± 35 11,45 | 50 1 | nt |
| Nemertea | nt | 50 ± 70.7 11,45 | 100 1 | nt |
| Bryozoa | nt | 49.7 ± 46.6 11,21,34,41,45 | 100 1 | 50 ± 57.7 16,21,34,41 |
| Echinodermata | nt | 62.5 ± 31.1 11,21,45 | 100 1 | 0 ± 0 16,21 |
| Tunicata | 20 1 | 93.3 ± 14.9 11,15,18,21,45 | nt | 100 ± 0 16,18,21 |
1 This study; x rest of references as in the list.