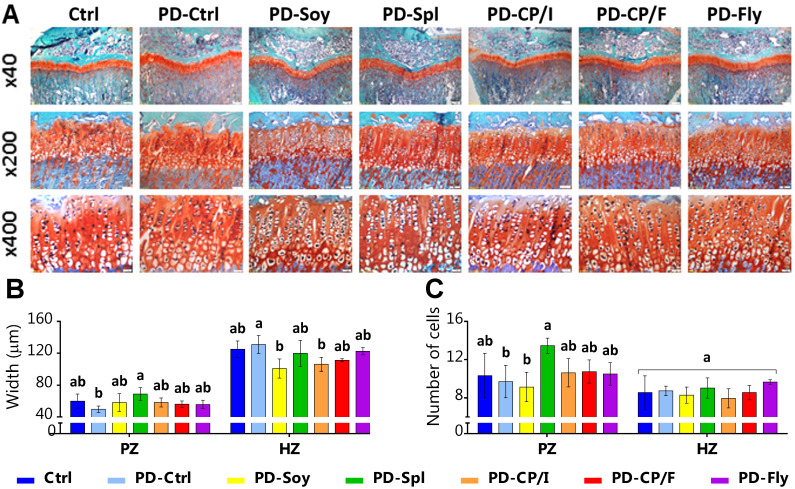
Figure 2.
Histological evaluation of the tibial growth plates of 9-week-old rats. Transverse tissue sections of 5 μm were prepared by microtome. GP width and number of cells have been measured in cell A software at 10 selected locations. (A) Safranin-O staining of the tibial GP. (B) GP zones’ width (μm). (C) GP zones’ number of cells. GP, growth plate; PZ, proliferative zone; HZ, hypertrophic zone. Values are expressed as mean ± SD of n = 4 samples/group, different superscript letters are significantly different (p < 0.05) by one-way ANOVA followed by Tukey’s test.

