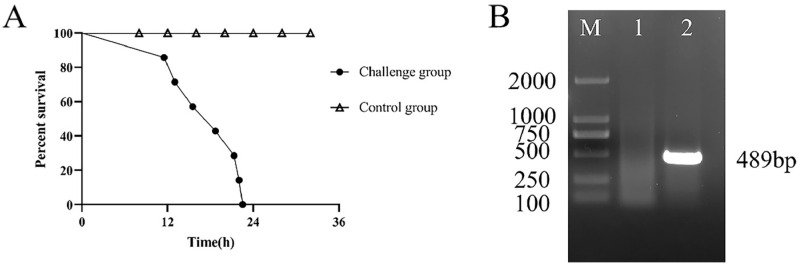
Figure 3.
Pathogenicity test results of K. pneumoniae. (A) Line chart of survival rate of K. pneumoniae-infected mice. (B) Electrophoresis results of KHE gene amplification in K. pneumoniae. “M” represents DL2000 DNA Marker. “1” represents negative control; “2” represents TSA single colony (The original gel figure can be found in Supplementary Figure S1).

