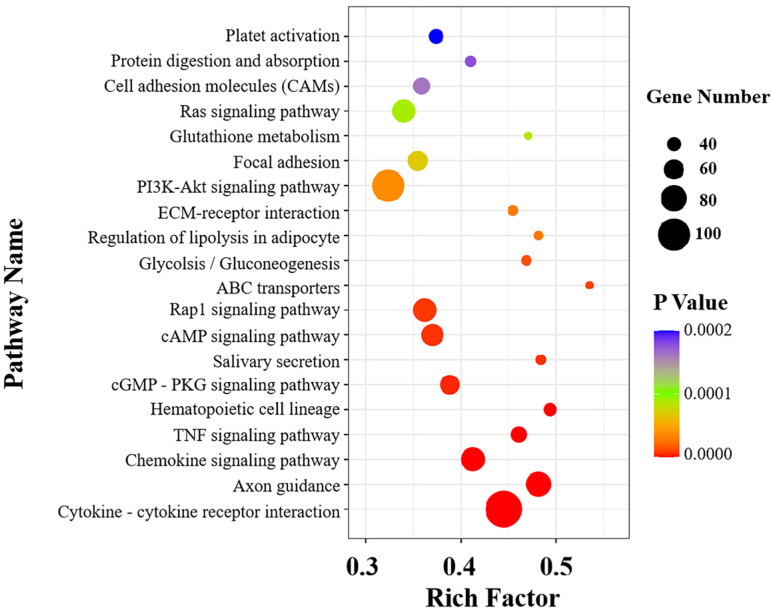
Figure 8.
Functional scatter diagram of significant enrichment of KEGG. The vertical axis represents the annotation information of the function, and the horizontal axis represents the rich factor corresponding to the function (the number of different genes annotated to the function was divided by the number of genes annotated to the function). The size of p-value is represented by the color of the point. The smaller the p-value is, the closer the color is to red. The number of different genes contained in each function is indicated by the size of the dots.

