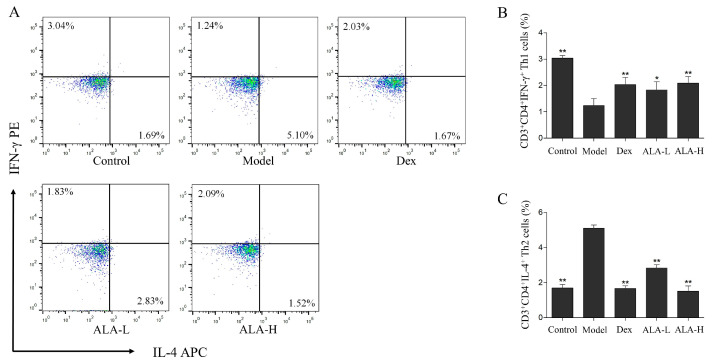
Figure 4.
Effect of ALA on the percentages of CD3+CD4+IFN-γ+ Th1 and CD3+CD4+IL-4+ Th2 cells in the spleen of AR mice. Representative dot plots of CD3+CD4+IFN-γ+ Th1 (in the upper left quadrant) and CD3+CD4+IL-4+ Th2 cells (in the lower right quadrant) (A), and the percentages of CD3+CD4+IFN-γ+ Th1 cells (B) and Th2 cells (C) in the SMCs separated from the spleen samples are analyzed via flow cytometry. Between-group comparisons were performed using one-way ANOVA coupled with LSD t-test (equal variances assumed) or Tamhane’s T2 test (equal variances not assumed). Data are expressed as mean ± SD; n = 3; * p < 0.05, ** p < 0.01 versus AR model. Dex, dexamethasone; ALA-L, low dose of α-linolenic acid; ALA-H, high dose of α-linolenic acid.

