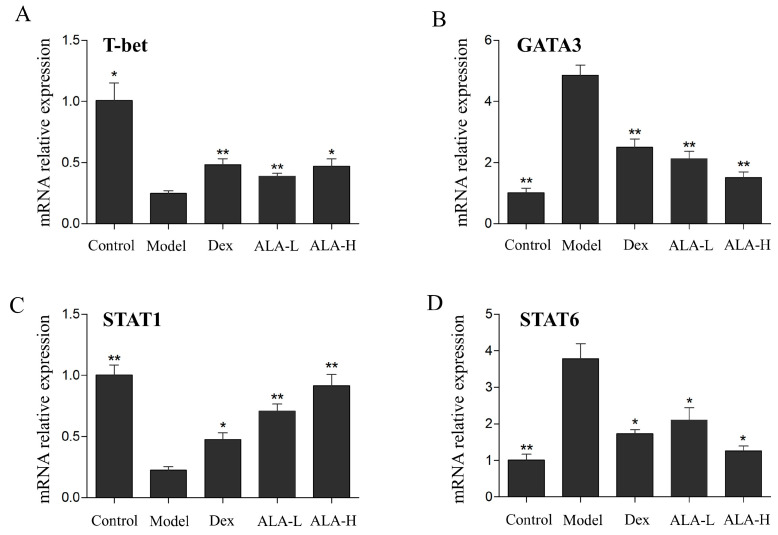
Figure 5.
Effect of ALA on the mRNA expression levels of T-bet (A), GATA3 (B), STAT1 (C), and STAT6 (D) in the nasal mucosa in AR mice. Between-group comparisons were performed using one-way ANOVA coupled with LSD t-test (equal variances assumed) or Tamhane’s T2 test (equal variances not assumed). Data are expressed as mean ± SD; n = 4; * p < 0.05, ** p < 0.01 versus AR model. Dex, dexamethasone; ALA-L, low dose of α-linolenic acid; ALA-H, high dose of α-linolenic acid.

