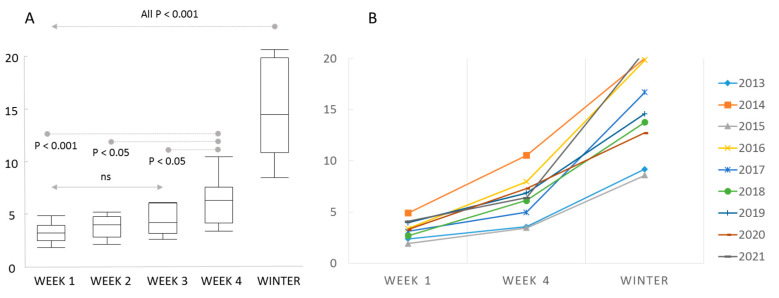
Figure 3.
Colony loss rates relative to the standardised week of response to the late summer/autumn survey. The winter colony loss rates are shown for comparison. (A) Box plots of averages among years with significance estimates. (B) Annual loss rates in autumn in response week 1 and week 4 and winter loss rates. The loss rates increase between week 1 and week 4 each year.

