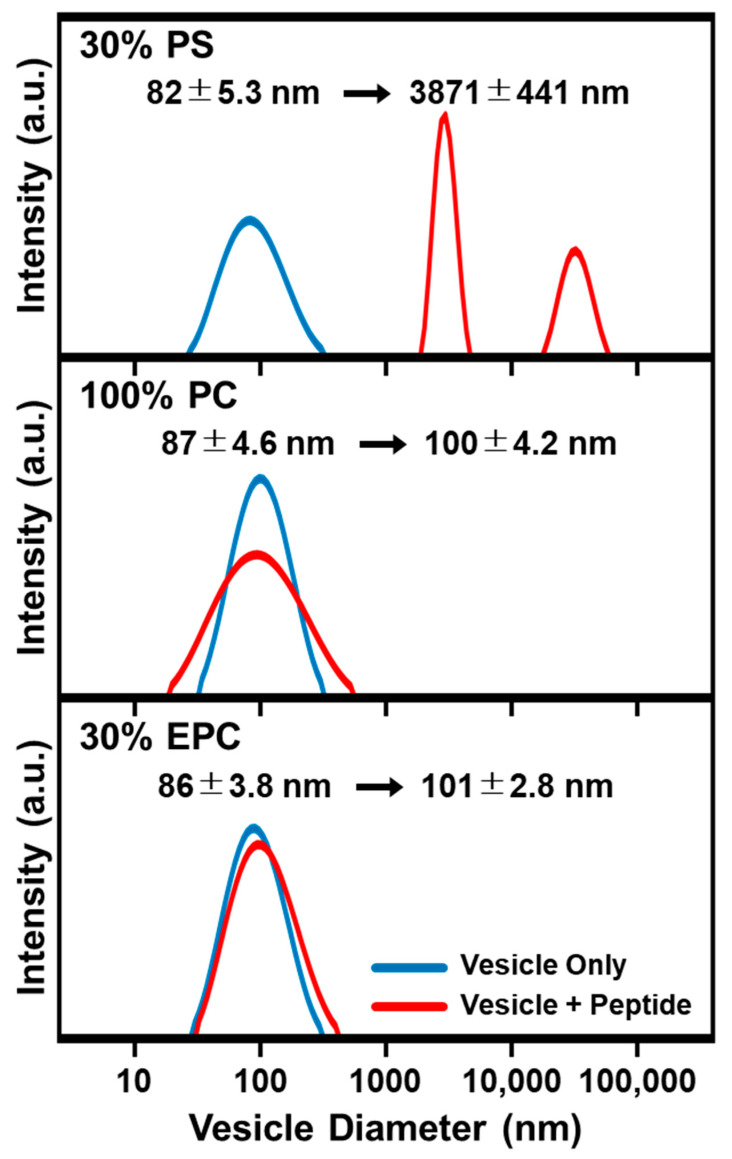
Figure 2.
DLS characterization of LTX-315 peptide effects on suspended lipid vesicles with different membrane surface charges. The size distribution of solution-phase lipid vesicles was obtained before (blue lines) and after incubating lipid vesicles with LTX-315 peptide (red lines) by dynamic light scattering (DLS) measurements. Corresponding changes in the size distribution are presented as Gaussian profiles for 70/30 DOPC/DOPS (top), 100 DOPC (middle), and 70/30 DOPC/DOEPC (bottom) lipid vesicles.

